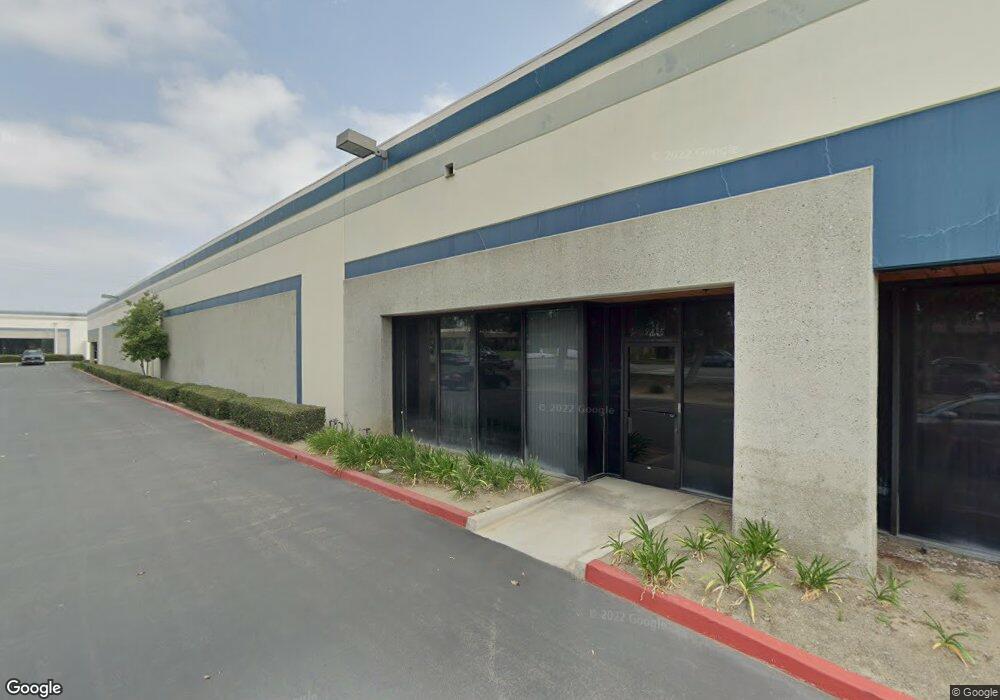
1833 S Campus Ave Ontario, CA 91761
Downtown Ontario NeighborhoodEstimated Value: $2,247,996
--
Bed
--
Bath
7,868
Sq Ft
$286/Sq Ft
Est. Value
About This Home
This home is located at 1833 S Campus Ave, Ontario, CA 91761 and is currently estimated at $2,247,996, approximately $285 per square foot. 1833 S Campus Ave is a home located in San Bernardino County with nearby schools including Bon View Elementary, De Anza Middle, and Ontario High School.
Ownership History
Date
Name
Owned For
Owner Type
Purchase Details
Closed on
May 13, 2012
Sold by
Signworld Us Inc
Bought by
Catrader Investment Llc
Current Estimated Value
Purchase Details
Closed on
Sep 10, 2009
Sold by
Provan Andrew J
Bought by
Signworld Us Inc
Purchase Details
Closed on
Dec 20, 2000
Sold by
Wolhaupter William F
Bought by
Provan Andrew J and Provan Susan L
Home Financials for this Owner
Home Financials are based on the most recent Mortgage that was taken out on this home.
Original Mortgage
$214,400
Interest Rate
6.92%
Mortgage Type
Commercial
Purchase Details
Closed on
Oct 21, 1994
Sold by
The Administrator Of Small Business Admi
Bought by
Wolhaupter William F and Andrew H Smith Trust
Purchase Details
Closed on
Oct 6, 1993
Sold by
Fidelity Mtg Trustee Service
Bought by
The Administrator Of The Small Bus Admin
Create a Home Valuation Report for This Property
The Home Valuation Report is an in-depth analysis detailing your home's value as well as a comparison with similar homes in the area
Home Values in the Area
Average Home Value in this Area
Purchase History
| Date | Buyer | Sale Price | Title Company |
|---|---|---|---|
| Catrader Investment Llc | $675,000 | Stewart Title Of California | |
| Signworld Us Inc | $610,000 | First American Title Ins Co | |
| Provan Andrew J | $430,000 | Old Republic Title Company | |
| Wolhaupter William F | $250,000 | -- | |
| The Administrator Of The Small Bus Admin | $329,000 | North American Title Co |
Source: Public Records
Mortgage History
| Date | Status | Borrower | Loan Amount |
|---|---|---|---|
| Previous Owner | Provan Andrew J | $214,400 | |
| Closed | Provan Andrew J | $174,000 |
Source: Public Records
Tax History Compared to Growth
Tax History
| Year | Tax Paid | Tax Assessment Tax Assessment Total Assessment is a certain percentage of the fair market value that is determined by local assessors to be the total taxable value of land and additions on the property. | Land | Improvement |
|---|---|---|---|---|
| 2025 | $9,101 | $847,837 | $280,099 | $567,738 |
| 2024 | $9,101 | $831,213 | $274,607 | $556,606 |
| 2023 | $8,845 | $814,915 | $269,223 | $545,692 |
| 2022 | $8,728 | $798,936 | $263,944 | $534,992 |
| 2021 | $8,675 | $783,271 | $258,769 | $524,502 |
| 2020 | $8,522 | $775,240 | $256,116 | $519,124 |
| 2019 | $8,449 | $760,039 | $251,094 | $508,945 |
| 2018 | $8,333 | $745,137 | $246,171 | $498,966 |
| 2017 | $8,033 | $730,526 | $241,344 | $489,182 |
| 2016 | $7,715 | $716,202 | $236,612 | $479,590 |
| 2015 | $7,664 | $705,444 | $233,058 | $472,386 |
| 2014 | $7,425 | $691,626 | $228,493 | $463,133 |
Source: Public Records
Map
Nearby Homes
- 2030 S Bon View Ave Unit G
- 840 E Cedar St
- 1650 S Campus Ave Unit 20
- 2119 S Phoenix Place
- 2127 S Monterey Ave
- 304 E Cedar St
- 2148 S Sultana Ave
- 1512 S Pleasant Ave
- 310 E Philadelphia St
- 310 E Philadelphia St Unit 35
- 310 E Philadelphia St Unit SPC 102
- 4233 S Grasly Paseo
- 4235 S Gasly Paseo
- 0 Vineyard Unit CV25067044
- 0 Phillips Unit CV23180894
- 926 E Skylark St
- 1343 S Sultana Ave
- 2408 S Taylor Place
- 1949 S Palm Place
- 2355 S Greenwood Place Unit A
- 1900 S Campus Ave
- 1758 S Campus Ave
- 610 E Francis St Unit B
- 1757 S Miramonte Ave
- 1752 S Campus Ave
- 1751 S Miramonte Ave
- 1746 S Campus Ave
- 1745 S Miramonte Ave
- 1758 S Miramonte Ave
- 1740 S Campus Ave
- 1752 S Miramonte Ave
- 1739 S Miramonte Ave
- 1734 S Campus Ave
- 1746 S Miramonte Ave
- 611 E Francis St
- 1733 S Miramonte Ave
- 1725 S Campus Ave
- 1728 S Campus Ave
- 1740 S Miramonte Ave
- 601 E Francis St