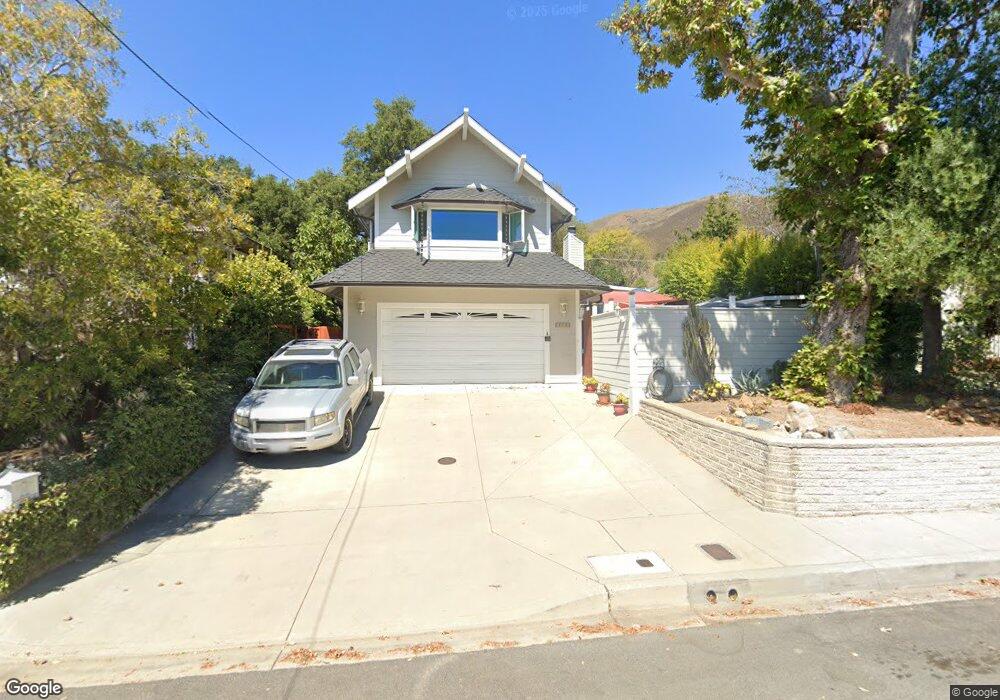
1834 Hays St San Luis Obispo, CA 93405
Cuesta Park NeighborhoodEstimated Value: $1,248,600 - $1,341,000
3
Beds
2
Baths
1,489
Sq Ft
$881/Sq Ft
Est. Value
About This Home
This home is located at 1834 Hays St, San Luis Obispo, CA 93405 and is currently estimated at $1,312,400, approximately $881 per square foot. 1834 Hays St is a home located in San Luis Obispo County with nearby schools including Bishop's Peak Elementary School, Laguna Middle School, and San Luis Obispo High School.
Ownership History
Date
Name
Owned For
Owner Type
Purchase Details
Closed on
Nov 25, 2019
Sold by
Jacobson Connie
Bought by
Jacobson Connie J and The Connie J Jacobson Living T
Current Estimated Value
Purchase Details
Closed on
Dec 19, 2011
Sold by
Jacobson Gregory C and Jacobson Connie
Bought by
Jacobson Connie
Purchase Details
Closed on
Nov 9, 1993
Sold by
Jacobson Gregory C
Bought by
Jacobson Gregory C and Jacobson Connie
Home Financials for this Owner
Home Financials are based on the most recent Mortgage that was taken out on this home.
Original Mortgage
$112,000
Interest Rate
6.88%
Purchase Details
Closed on
Sep 20, 1993
Sold by
Va
Bought by
Jacobson Gregory C
Home Financials for this Owner
Home Financials are based on the most recent Mortgage that was taken out on this home.
Original Mortgage
$112,000
Interest Rate
6.88%
Create a Home Valuation Report for This Property
The Home Valuation Report is an in-depth analysis detailing your home's value as well as a comparison with similar homes in the area
Home Values in the Area
Average Home Value in this Area
Purchase History
| Date | Buyer | Sale Price | Title Company |
|---|---|---|---|
| Jacobson Connie J | -- | None Available | |
| Jacobson Connie | -- | None Available | |
| Jacobson Gregory C | -- | First American Title Insuran | |
| Jacobson Gregory C | -- | First American Title Insuran |
Source: Public Records
Mortgage History
| Date | Status | Borrower | Loan Amount |
|---|---|---|---|
| Previous Owner | Jacobson Gregory C | $112,000 |
Source: Public Records
Tax History Compared to Growth
Tax History
| Year | Tax Paid | Tax Assessment Tax Assessment Total Assessment is a certain percentage of the fair market value that is determined by local assessors to be the total taxable value of land and additions on the property. | Land | Improvement |
|---|---|---|---|---|
| 2025 | $2,841 | $269,322 | $85,351 | $183,971 |
| 2024 | $2,788 | $264,042 | $83,678 | $180,364 |
| 2023 | $2,788 | $258,866 | $82,038 | $176,828 |
| 2022 | $2,612 | $253,791 | $80,430 | $173,361 |
| 2021 | $2,569 | $248,815 | $78,853 | $169,962 |
| 2020 | $2,542 | $246,265 | $78,045 | $168,220 |
| 2019 | $2,514 | $241,437 | $76,515 | $164,922 |
| 2018 | $2,463 | $236,704 | $75,015 | $161,689 |
| 2017 | $2,413 | $232,064 | $73,545 | $158,519 |
| 2016 | $2,364 | $227,514 | $72,103 | $155,411 |
| 2015 | $2,327 | $224,097 | $71,020 | $153,077 |
| 2014 | $2,150 | $219,708 | $69,629 | $150,079 |
Source: Public Records
Map
Nearby Homes
- 171 Buena Vista Ave
- 2298 Santa Ynez Ave
- 311 Longview Ln
- 623 Grove St
- 2306 Santa Ynez Ave
- 441 Kentucky St
- 31 Hathway Ave
- 1987 Corralitos Ave
- 2207 San Luis Dr
- 2171 San Luis Dr
- 364 Hathway Ave
- 45 Stenner St Unit H
- 1185 E Foothill Blvd Unit 25
- 1213 Murray Ave
- 60 Casa St
- 879 Johnson Ave
- 664 Toro St
- 1308 Monterey St Unit 340
- 1229 Mill St
- 1214 Mill St