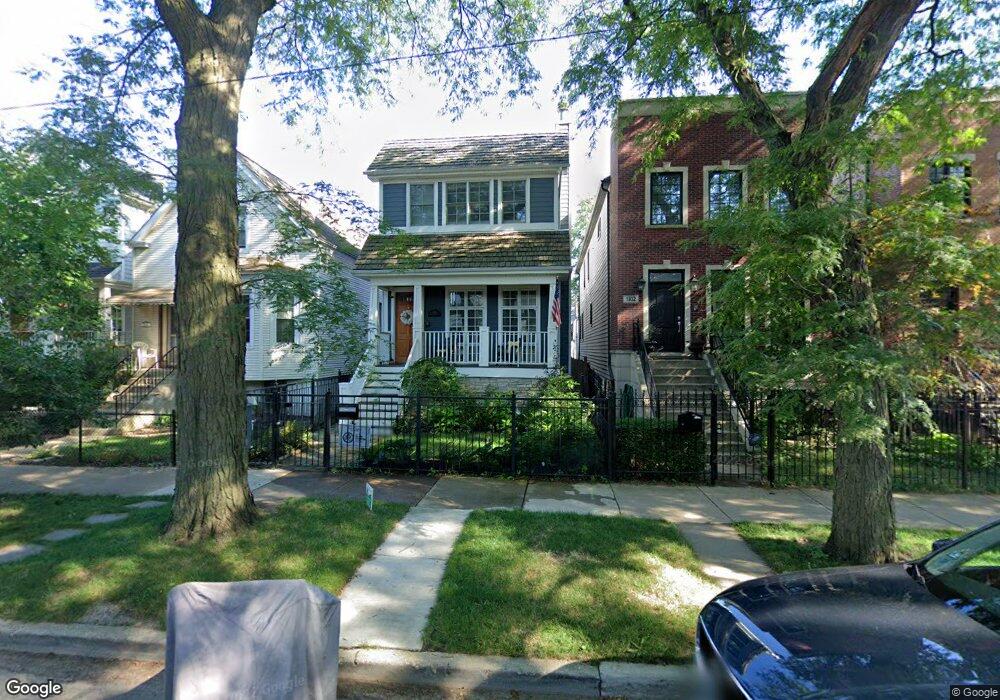
1834 W Nelson St Unit 1 Chicago, IL 60657
Roscoe Village NeighborhoodEstimated Value: $1,803,000 - $2,459,000
4
Beds
5
Baths
2,622
Sq Ft
$767/Sq Ft
Est. Value
About This Home
This home is located at 1834 W Nelson St Unit 1, Chicago, IL 60657 and is currently estimated at $2,011,002, approximately $766 per square foot. 1834 W Nelson St Unit 1 is a home located in Cook County with nearby schools including Jahn School of Fine Arts, Lake View High School, and Saint Luke Academy.
Ownership History
Date
Name
Owned For
Owner Type
Purchase Details
Closed on
Oct 13, 2016
Sold by
Hudak Tom H and Hudak Kelly A
Bought by
Blust Layla Dendinger and Blust Kyle J
Current Estimated Value
Home Financials for this Owner
Home Financials are based on the most recent Mortgage that was taken out on this home.
Original Mortgage
$1,072,000
Outstanding Balance
$870,403
Interest Rate
3.87%
Mortgage Type
New Conventional
Estimated Equity
$1,140,599
Purchase Details
Closed on
Aug 20, 2014
Sold by
R Developing Group Inc
Bought by
Hudak Tom H and Hudak Kelly A
Home Financials for this Owner
Home Financials are based on the most recent Mortgage that was taken out on this home.
Original Mortgage
$867,500
Interest Rate
2.5%
Mortgage Type
Adjustable Rate Mortgage/ARM
Purchase Details
Closed on
Nov 26, 2013
Sold by
R Developing Group Inc
Bought by
1834 W Nelson Llc
Purchase Details
Closed on
Sep 26, 2013
Sold by
Chicago Title Land Trust Co
Bought by
R Developing Group Inc
Home Financials for this Owner
Home Financials are based on the most recent Mortgage that was taken out on this home.
Original Mortgage
$408,750
Interest Rate
3.25%
Mortgage Type
Construction
Create a Home Valuation Report for This Property
The Home Valuation Report is an in-depth analysis detailing your home's value as well as a comparison with similar homes in the area
Home Values in the Area
Average Home Value in this Area
Purchase History
| Date | Buyer | Sale Price | Title Company |
|---|---|---|---|
| Blust Layla Dendinger | $1,340,000 | Proper Title Llc | |
| Hudak Tom H | $1,462,500 | Cti | |
| 1834 W Nelson Llc | -- | None Available | |
| R Developing Group Inc | $520,000 | None Available |
Source: Public Records
Mortgage History
| Date | Status | Borrower | Loan Amount |
|---|---|---|---|
| Open | Blust Layla Dendinger | $1,072,000 | |
| Previous Owner | Hudak Tom H | $867,500 | |
| Previous Owner | R Developing Group Inc | $408,750 |
Source: Public Records
Tax History Compared to Growth
Tax History
| Year | Tax Paid | Tax Assessment Tax Assessment Total Assessment is a certain percentage of the fair market value that is determined by local assessors to be the total taxable value of land and additions on the property. | Land | Improvement |
|---|---|---|---|---|
| 2024 | $27,429 | $146,001 | $48,438 | $97,563 |
| 2023 | $26,738 | $130,001 | $39,063 | $90,938 |
| 2022 | $26,738 | $130,001 | $39,063 | $90,938 |
| 2021 | $26,142 | $129,999 | $39,062 | $90,937 |
| 2020 | $27,578 | $123,796 | $17,500 | $106,296 |
| 2019 | $27,035 | $134,561 | $17,500 | $117,061 |
| 2018 | $26,580 | $134,561 | $17,500 | $117,061 |
| 2017 | $31,437 | $146,035 | $15,625 | $130,410 |
| 2016 | $29,249 | $146,035 | $15,625 | $130,410 |
| 2015 | $26,760 | $146,035 | $15,625 | $130,410 |
| 2014 | $14,936 | $80,499 | $12,500 | $67,999 |
| 2013 | $9,364 | $51,486 | $12,500 | $38,986 |
Source: Public Records
Map
Nearby Homes
- 1759 W Wellington Ave
- 1926 W Wellington Ave
- 3009 N Damen Ave Unit 2
- 1732 W Fletcher St
- 2903 N Wolcott Ave Unit A
- 1935 W Belmont Ave Unit 2
- 1712 W Fletcher St
- 3201 N Ravenswood Ave Unit 301
- 1738 W Belmont Ave Unit 1R
- 3117 N Paulina St Unit G
- 1938 W Belmont Ave Unit 2
- 2020 W Barry Ave
- 1808 W Diversey Pkwy Unit E
- 1712 W Surf St Unit 40
- 1955 W Melrose St Unit 2
- 1928 W Wolfram St
- 2801 N Wolcott Ave Unit E
- 1635 W Belmont Ave Unit 422
- 1932 W Wolfram St
- 1710 W Surf St Unit 41
- 1834 W Nelson St
- 1832 W Nelson St
- 1836 W Nelson St
- 1830 W Nelson St
- 1840 W Nelson St
- 1826 W Nelson St
- 1842 W Nelson St
- 1844 W Nelson St
- 1824 W Nelson St
- 1846 W Nelson St
- 1820 W Nelson St
- 1839 W Barry Ave
- 1833 W Barry Ave
- 1850 W Nelson St
- 1831 W Barry Ave
- 1827 W Barry Ave
- 1827 W Barry Ave
- 1841 W Barry Ave
- 1837 W Nelson St
- 1837 W Nelson St Unit 1