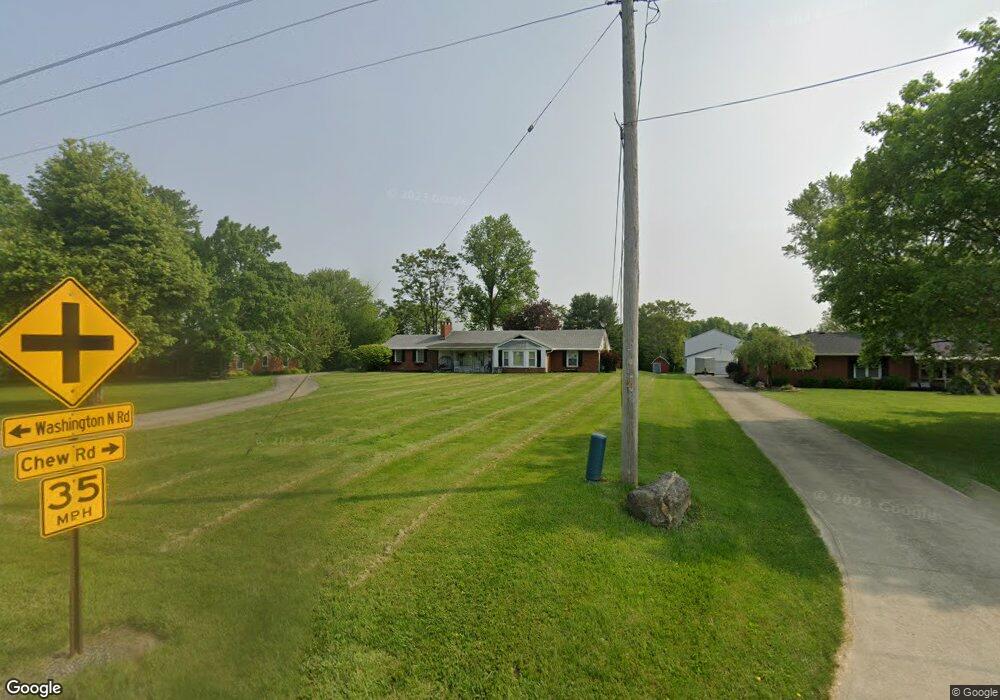
1835 Mansfield Lucas Rd Mansfield, OH 44903
Estimated Value: $249,000 - $282,000
3
Beds
2
Baths
1,665
Sq Ft
$156/Sq Ft
Est. Value
About This Home
This home is located at 1835 Mansfield Lucas Rd, Mansfield, OH 44903 and is currently estimated at $260,187, approximately $156 per square foot. 1835 Mansfield Lucas Rd is a home located in Richland County with nearby schools including Lucas Elementary School, Lucas Heritage Middle School, and Lucas High School.
Ownership History
Date
Name
Owned For
Owner Type
Purchase Details
Closed on
Sep 25, 2017
Sold by
Schaefer Donald R and Schaefer Andrea L
Bought by
Blanton Kelcie A
Current Estimated Value
Home Financials for this Owner
Home Financials are based on the most recent Mortgage that was taken out on this home.
Original Mortgage
$121,500
Outstanding Balance
$100,603
Interest Rate
3.5%
Mortgage Type
Adjustable Rate Mortgage/ARM
Estimated Equity
$159,584
Purchase Details
Closed on
Feb 4, 2016
Sold by
Hatfield Karen and Kirkendall Kevin
Bought by
Schaefer Donald R and Schaefer Andrea L
Purchase Details
Closed on
Jun 10, 2009
Sold by
Kirkendahl Clarence O and Kirkendahl Carrie F
Bought by
Kirkendall Clarence O and Kirkendall Carrie F
Create a Home Valuation Report for This Property
The Home Valuation Report is an in-depth analysis detailing your home's value as well as a comparison with similar homes in the area
Home Values in the Area
Average Home Value in this Area
Purchase History
| Date | Buyer | Sale Price | Title Company |
|---|---|---|---|
| Blanton Kelcie A | $135,000 | Chicago Title | |
| Schaefer Donald R | $75,000 | Chicago Title | |
| Kirkendall Clarence O | -- | Attorney |
Source: Public Records
Mortgage History
| Date | Status | Borrower | Loan Amount |
|---|---|---|---|
| Open | Blanton Kelcie A | $121,500 |
Source: Public Records
Tax History Compared to Growth
Tax History
| Year | Tax Paid | Tax Assessment Tax Assessment Total Assessment is a certain percentage of the fair market value that is determined by local assessors to be the total taxable value of land and additions on the property. | Land | Improvement |
|---|---|---|---|---|
| 2024 | $2,953 | $67,570 | $11,230 | $56,340 |
| 2023 | $2,953 | $67,570 | $11,230 | $56,340 |
| 2022 | $2,556 | $51,240 | $9,640 | $41,600 |
| 2021 | $2,597 | $51,240 | $9,640 | $41,600 |
| 2020 | $2,466 | $51,240 | $9,640 | $41,600 |
| 2019 | $2,211 | $42,970 | $8,080 | $34,890 |
| 2018 | $2,275 | $42,970 | $8,080 | $34,890 |
| 2017 | $2,159 | $42,970 | $8,080 | $34,890 |
| 2016 | $2,030 | $38,170 | $6,880 | $31,290 |
| 2015 | $1,952 | $38,170 | $6,880 | $31,290 |
| 2014 | $1,963 | $38,170 | $6,880 | $31,290 |
| 2012 | $769 | $39,360 | $7,100 | $32,260 |
Source: Public Records
Map
Nearby Homes
- 1875 Mansfield Lucas Rd
- 929 Antionette Dr
- 1679 Pulver Rd
- 0 Woodville Rd Unit Lot 14952, 14953
- 0 Woodville Rd Unit Lot 14954, 14955
- 0 Woodville Rd Unit Lot 14956, 14957,
- 0 State Route 39 & I-71 Southeast Quadrant
- 0 State Route 39 & I-71 Northeast Quadrant
- 2061 Washington North Rd
- 794 Mansfield Washington Rd
- 716 Mansfield Washington Rd
- 1135 E Hanley Rd
- 405 Plainview Ave
- 369 Davidson St
- 419 Pearl Ave
- 1599 S Main St
- 138 Cliffbrook Dr
- 1680 S Main St
- 413 Ruby Ave
- 65 Logan Rd
- 1855 Mansfield Lucas Rd
- 1801 Mansfield Lucas Rd
- 1865 Mansfield Lucas Rd
- 1856 Mansfield Lucas Rd
- 1300 Max Walton Dr
- 960 Chew Rd
- 1227 Washington North Rd
- 1265 Washington North Rd
- 1265 Washington Rd N
- 2834 Scenic View Dr
- 988 Chew Rd
- 1768 Mansfield Lucas Rd
- 1899 Mansfield Lucas Rd
- 1244 Washington North Rd
- 1745 Mansfield Lucas Rd
- 1288 Max Walton Dr
- 1305 Max Walton Dr
- 1260 Washington North Rd
- 1014 Chew Rd
- 1311 Washington Rd N