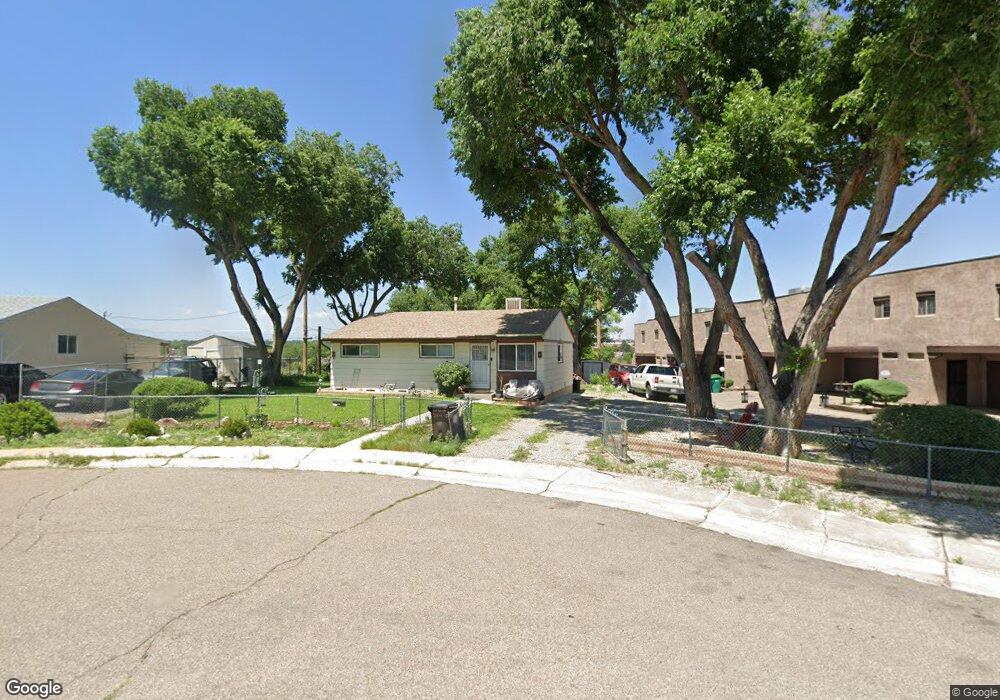
1835 Mohawk Rd Pueblo, CO 81001
Belmont NeighborhoodEstimated Value: $196,746 - $227,000
3
Beds
1
Bath
936
Sq Ft
$231/Sq Ft
Est. Value
About This Home
This home is located at 1835 Mohawk Rd, Pueblo, CO 81001 and is currently estimated at $215,937, approximately $230 per square foot. 1835 Mohawk Rd is a home located in Pueblo County with nearby schools including Haaff Elementary School, Heaton Middle School, and East High School.
Ownership History
Date
Name
Owned For
Owner Type
Purchase Details
Closed on
Apr 29, 2019
Sold by
Tripp Michael and Tripp Betty Jean
Bought by
Bjnm Properties Llc
Current Estimated Value
Purchase Details
Closed on
May 31, 2002
Sold by
Tripp Bj + M L/Miller B J
Bought by
Tripp Michael L + Betty Jean
Purchase Details
Closed on
May 22, 2001
Sold by
Miller Betty
Bought by
Tripp Bj + M L/Miller B J
Purchase Details
Closed on
Mar 8, 1999
Sold by
Miller Charles Gary + Betty J
Bought by
Miller Betty
Purchase Details
Closed on
Oct 27, 1997
Sold by
Miller Charles Gary + Betty J
Bought by
Miller Charles Gary + Betty J
Purchase Details
Closed on
Dec 29, 1988
Sold by
Miller Gary
Bought by
Miller Charles Gary + Betty J
Purchase Details
Closed on
Sep 15, 1987
Bought by
Miller Gary
Purchase Details
Closed on
Feb 7, 1968
Sold by
Mckeown Ruth M
Bought by
Valdez Elias + Agnes V
Purchase Details
Closed on
Jan 30, 1968
Sold by
Valdez Elias + Agnes V
Bought by
Same
Create a Home Valuation Report for This Property
The Home Valuation Report is an in-depth analysis detailing your home's value as well as a comparison with similar homes in the area
Home Values in the Area
Average Home Value in this Area
Purchase History
| Date | Buyer | Sale Price | Title Company |
|---|---|---|---|
| Bjnm Properties Llc | -- | None Available | |
| Tripp Michael L + Betty Jean | -- | -- | |
| Tripp Bj + M L/Miller B J | -- | -- | |
| Miller Betty | -- | -- | |
| Miller Charles Gary + Betty J | -- | -- | |
| Miller Charles Gary + Betty J | -- | -- | |
| Miller Gary | $28,000 | -- | |
| Valdez Elias + Agnes V | $11,000 | -- | |
| Same | -- | -- |
Source: Public Records
Tax History
| Year | Tax Paid | Tax Assessment Tax Assessment Total Assessment is a certain percentage of the fair market value that is determined by local assessors to be the total taxable value of land and additions on the property. | Land | Improvement |
|---|---|---|---|---|
| 2024 | $799 | $8,110 | -- | -- |
| 2023 | $808 | $11,800 | $1,340 | $10,460 |
| 2022 | $908 | $9,150 | $1,390 | $7,760 |
| 2021 | $937 | $9,410 | $1,430 | $7,980 |
| 2020 | $674 | $9,410 | $1,430 | $7,980 |
| 2019 | $675 | $6,681 | $644 | $6,037 |
| 2018 | $545 | $6,015 | $648 | $5,367 |
| 2017 | $551 | $6,015 | $648 | $5,367 |
| 2016 | $510 | $5,611 | $716 | $4,895 |
| 2015 | $254 | $5,611 | $716 | $4,895 |
| 2014 | $504 | $5,558 | $716 | $4,842 |
Source: Public Records
Map
Nearby Homes
- 1901 Mohawk Rd
- 1915 Mohawk Rd
- 21 Glenmore Rd
- 1914 Cuchara Dr
- 1918 Cuchara Dr
- 1731 Jerry Murphy Rd
- 55 Bonnymede Rd Unit S
- 146 Douglas Ln
- 136 Douglas Ln
- 32 Scotland Rd
- 12 Cuesta Place
- 1732 Comanche Rd
- 30 Bellita Dr
- 000 Dillon Dr
- 00 Dillon Dr
- 0 Dillon Dr Unit 232880
- 11 Towerbridge Ct Unit A
- 130 Scotland Rd Unit D
- 7 Baybridge Ct
- 124 Scotland Rd Unit E
- 1903 Mohawk Rd Unit 1903
- 1905 Mohawk Rd
- 1907 Mohawk Rd
- 1833 Mohawk Rd
- 1911 Mohawk Rd Unit 1911
- 1917 Mohawk Rd Unit 1917
- 1921 Mohawk Rd Unit 1921
- 1831 Mohawk Rd
- 1923 Mohawk Rd
- 1919 Mohawk Rd Unit 1919
- 2003 Mohawk Rd Unit 2003
- 1832 Mohawk Rd
- 1829 Mohawk Rd
- 1830 Mohawk Rd
- 2007 Mohawk Rd Unit 2007
- 2009 Mohawk Rd Unit 2009
- 2005 Mohawk Rd Unit 2005
- 2011 Mohawk Rd
- 2001 Mohawk Rd
- 1828 Mohawk Rd
Your Personal Tour Guide
Ask me questions while you tour the home.