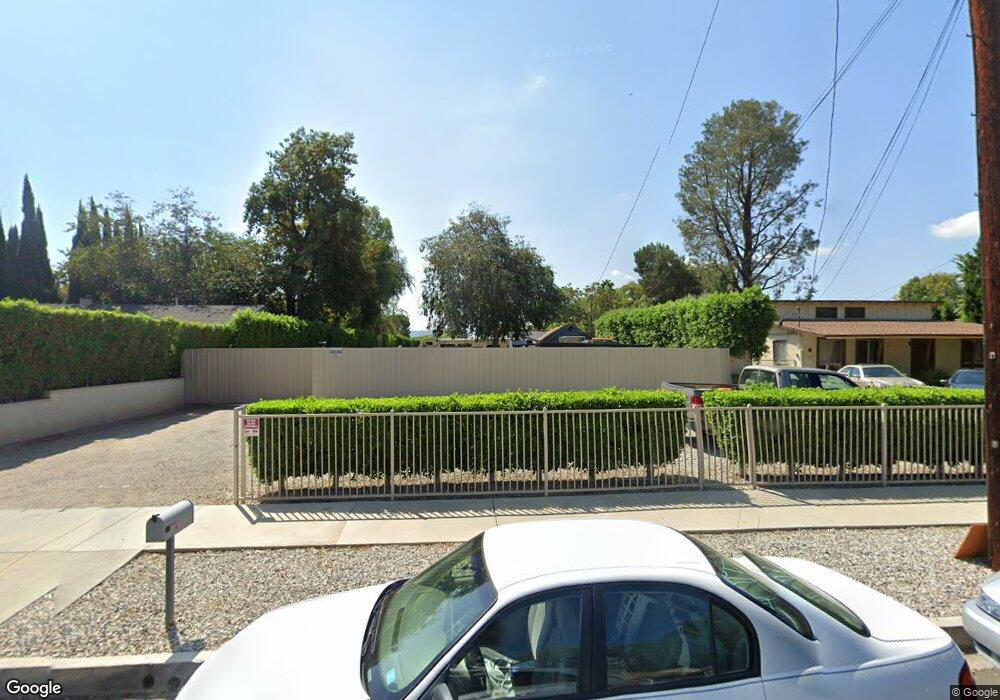
18356 Strathern St Reseda, CA 91335
Estimated Value: $735,000 - $1,043,000
1
Bed
1
Bath
840
Sq Ft
$1,049/Sq Ft
Est. Value
About This Home
This home is located at 18356 Strathern St, Reseda, CA 91335 and is currently estimated at $881,456, approximately $1,049 per square foot. 18356 Strathern St is a home located in Los Angeles County with nearby schools including Blythe Street Elementary, Northridge Middle School, and Northridge Academy High.
Ownership History
Date
Name
Owned For
Owner Type
Purchase Details
Closed on
Sep 12, 2014
Sold by
J A C I Development Llc
Bought by
Tinoco Jose Maximo and Tinoco Marcia E
Current Estimated Value
Purchase Details
Closed on
Dec 22, 2008
Sold by
Tinoco Jose Maximo and Tinoco Marcia Emilia Arias
Bought by
J A C I Development Llc
Purchase Details
Closed on
Mar 11, 2008
Sold by
Kelly Bryon
Bought by
Tinoco Jose Maximo
Home Financials for this Owner
Home Financials are based on the most recent Mortgage that was taken out on this home.
Original Mortgage
$352,000
Interest Rate
6%
Mortgage Type
Purchase Money Mortgage
Purchase Details
Closed on
Sep 24, 2007
Sold by
Kelly Bryon and Kelly Gary Charles
Bought by
Kelly Bryon
Create a Home Valuation Report for This Property
The Home Valuation Report is an in-depth analysis detailing your home's value as well as a comparison with similar homes in the area
Home Values in the Area
Average Home Value in this Area
Purchase History
| Date | Buyer | Sale Price | Title Company |
|---|---|---|---|
| Tinoco Jose Maximo | -- | Fidelity | |
| J A C I Development Llc | -- | None Available | |
| Tinoco Jose Maximo | $440,000 | Southland Title Corporation | |
| Kelly Bryon | -- | Accommodation |
Source: Public Records
Mortgage History
| Date | Status | Borrower | Loan Amount |
|---|---|---|---|
| Previous Owner | Tinoco Jose Maximo | $352,000 |
Source: Public Records
Tax History
| Year | Tax Paid | Tax Assessment Tax Assessment Total Assessment is a certain percentage of the fair market value that is determined by local assessors to be the total taxable value of land and additions on the property. | Land | Improvement |
|---|---|---|---|---|
| 2025 | $6,191 | $469,912 | $426,651 | $43,261 |
| 2024 | $6,191 | $460,699 | $418,286 | $42,413 |
| 2023 | $6,081 | $451,667 | $410,085 | $41,582 |
| 2022 | $5,820 | $442,812 | $402,045 | $40,767 |
| 2021 | $5,754 | $434,130 | $394,162 | $39,968 |
| 2019 | $5,597 | $421,256 | $382,472 | $38,784 |
| 2018 | $5,155 | $412,997 | $374,973 | $38,024 |
| 2016 | $4,930 | $396,962 | $360,413 | $36,549 |
| 2015 | $4,860 | $391,000 | $355,000 | $36,000 |
| 2014 | $4,898 | $384,000 | $349,000 | $35,000 |
Source: Public Records
Map
Nearby Homes
- 8031 Canby Ave Unit 4
- 18404 Arminta St
- 8051 Etiwanda Ave
- 18320 Ingomar St
- 8134 Baird Ave
- 7732 Garden Grove Ave
- 7758 Chimineas Ave
- 7651 Reseda Blvd Unit 12T
- 7641 Reseda Blvd Unit 87Z
- 18347 Saticoy St Unit 28
- 18347 Saticoy St Unit 35
- 18347 Saticoy St Unit 6
- 18347 Saticoy St Unit 24
- 18425 Saticoy St Unit 4
- 18425 Saticoy St Unit 1
- 7625 Reseda Blvd Unit 104
- 8350 Reseda Blvd
- 7848 Chastain Ave
- 18443 W Montage Ln
- 8006 Zelzah Ave
- 18404 Strathern St
- 18346 Strathern St
- 18414 Strathern St
- 18410 Strathern St
- 18338 Strathern St
- 18332 Strathern St
- 18420 Strathern St
- 18355 Strathern St
- 18349 Strathern St
- 18338 Blythe St
- 18325 Blythe St
- 18341 Strathern St
- 18324 Strathern St
- 18334 Blythe St
- 7938 N Keer Dr
- 18403 Arminta St
- 7936 N Keer Dr
- 7940 N Keer Dr
- 7934 N Keer Dr
- 7942 N Keer Dr
Your Personal Tour Guide
Ask me questions while you tour the home.