Estimated Value: $221,000 - $255,000
3
Beds
2
Baths
1,564
Sq Ft
$156/Sq Ft
Est. Value
About This Home
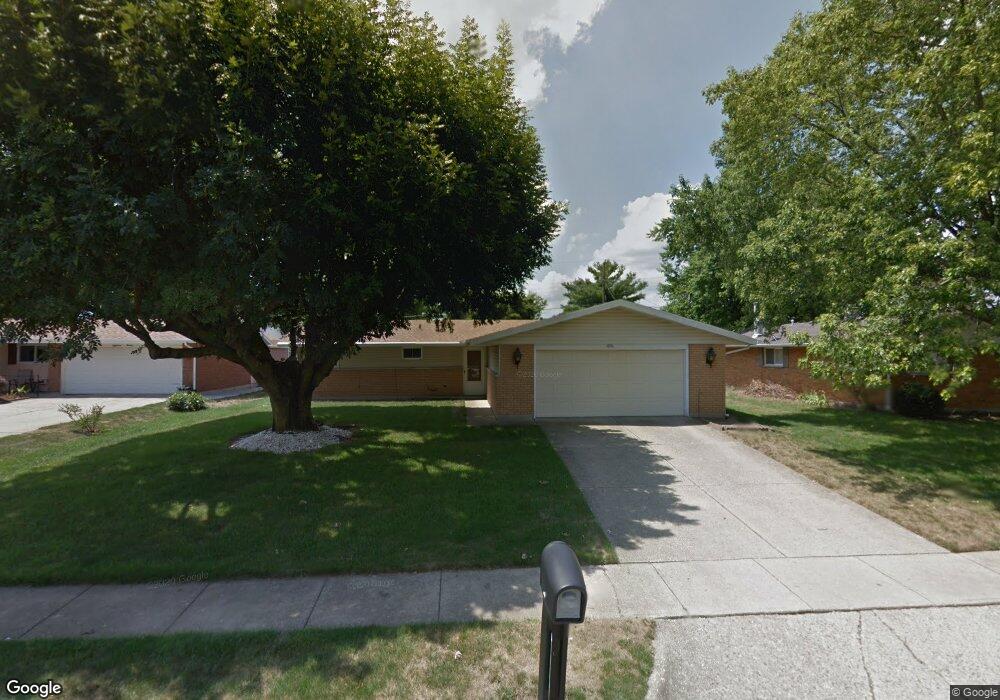
This home is located at 1836 Tahoe Dr, Xenia, OH 45385 and is currently estimated at $243,212, approximately $155 per square foot. 1836 Tahoe Dr is a home located in Greene County with nearby schools including Xenia High School and Summit Academy Community School for Alternative Learners - Xenia.
Ownership History
Date
Name
Owned For
Owner Type
Purchase Details
Closed on
Aug 11, 2021
Sold by
Mccormick Kathleen P and Mccormick Luther T
Bought by
Martin Alexander D and Martin Kristen N
Current Estimated Value
Home Financials for this Owner
Home Financials are based on the most recent Mortgage that was taken out on this home.
Original Mortgage
$135,000
Outstanding Balance
$122,385
Interest Rate
2.7%
Mortgage Type
New Conventional
Estimated Equity
$120,827
Purchase Details
Closed on
Jul 30, 2020
Sold by
Caudill Ashley E
Bought by
Mccormick Kathleen P and Mccormick Luther T
Home Financials for this Owner
Home Financials are based on the most recent Mortgage that was taken out on this home.
Original Mortgage
$134,900
Interest Rate
3.1%
Mortgage Type
VA
Purchase Details
Closed on
Dec 22, 2015
Sold by
Harris Paula N
Bought by
Caudill Ashley E
Purchase Details
Closed on
Jul 1, 1987
Bought by
Harris Paula N
Create a Home Valuation Report for This Property
The Home Valuation Report is an in-depth analysis detailing your home's value as well as a comparison with similar homes in the area
Home Values in the Area
Average Home Value in this Area
Purchase History
| Date | Buyer | Sale Price | Title Company |
|---|---|---|---|
| Martin Alexander D | -- | New Title Company Name | |
| Mccormick Kathleen P | $134,500 | First Ohio Title Insurance | |
| Caudill Ashley E | $93,000 | None Available | |
| Harris Paula N | $45,000 | -- |
Source: Public Records
Mortgage History
| Date | Status | Borrower | Loan Amount |
|---|---|---|---|
| Open | Martin Alexander D | $135,000 | |
| Previous Owner | Mccormick Kathleen P | $134,900 |
Source: Public Records
Tax History Compared to Growth
Tax History
| Year | Tax Paid | Tax Assessment Tax Assessment Total Assessment is a certain percentage of the fair market value that is determined by local assessors to be the total taxable value of land and additions on the property. | Land | Improvement |
|---|---|---|---|---|
| 2024 | $2,943 | $68,770 | $10,540 | $58,230 |
| 2023 | $2,943 | $68,770 | $10,540 | $58,230 |
| 2022 | $2,640 | $52,630 | $6,200 | $46,430 |
| 2021 | $2,247 | $46,890 | $6,200 | $40,690 |
| 2020 | $2,284 | $46,890 | $6,200 | $40,690 |
| 2019 | $1,773 | $34,270 | $6,000 | $28,270 |
| 2018 | $1,780 | $34,270 | $6,000 | $28,270 |
| 2017 | $1,729 | $34,270 | $6,000 | $28,270 |
| 2016 | $1,672 | $32,440 | $6,000 | $26,440 |
| 2015 | $838 | $32,440 | $6,000 | $26,440 |
| 2014 | $1,604 | $32,440 | $6,000 | $26,440 |
Source: Public Records
Map
Nearby Homes
- 1968 El Camino Dr
- 2094 Malibu Trail
- 2018 Tahoe Dr
- 1872 Harris Ln
- 1815 Promenade Ln
- 493 Hollywood Blvd
- 499 Hollywood Blvd
- 1791 Palmer Ct
- 1820 Palmer Ct
- 1814 Palmer Ct
- 1808 Palmer Ct
- 1802 Palmer Ct
- 1796 Palmer Ct
- 517 Hollywood Blvd
- 523 Hollywood Blvd
- 532 Hollywood Blvd
- 15 Sexton Dr
- Harmony Plan at Grandstone Trace
- Newcastle Plan at Grandstone Trace
- Pendleton Plan at Grandstone Trace
- 1846 Tahoe Dr
- 1823 Wilshire Dr
- 1839 Wilshire Dr
- 1808 Tahoe Dr
- 1860 Tahoe Dr
- 1803 Wilshire Dr
- 1821 Tahoe Dr
- 1855 Wilshire Dr
- 184 Beverly Place
- 1794 Tahoe Dr
- 1785 Wilshire Dr
- 1805 Tahoe Dr
- 167 Beverly Place
- 1872 Tahoe Dr
- 1869 Wilshire Dr
- 1826 Wilshire Dr
- 1785 Tahoe Dr
- 1774 Tahoe Dr
- 1891 Tahoe Dr
- 1842 Wilshire Dr