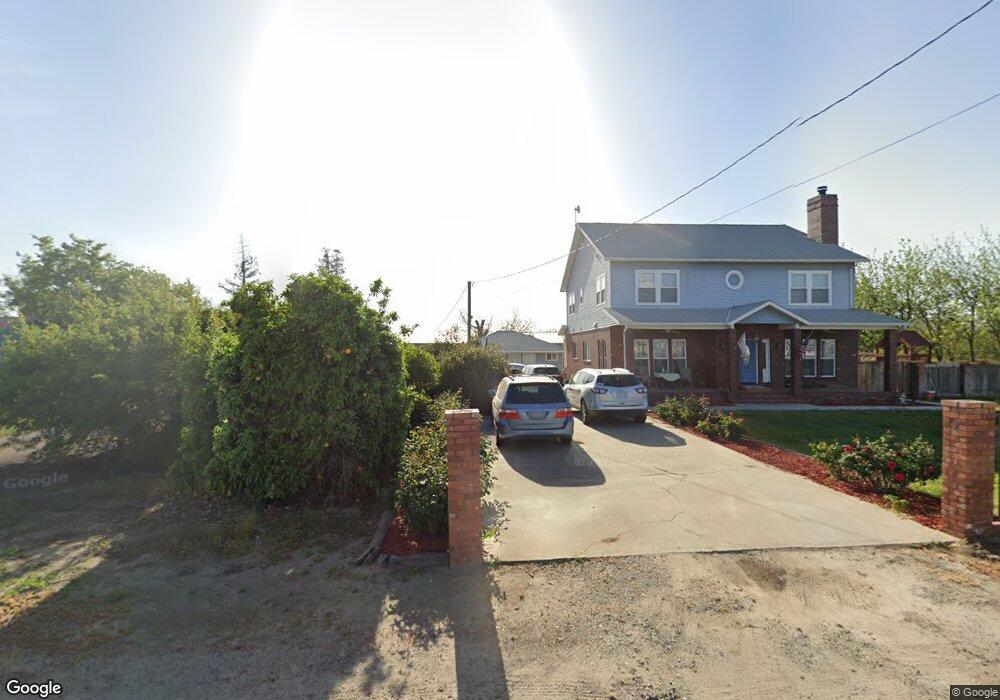
1837 Clinton Rd Hughson, CA 95326
Estimated Value: $1,038,000 - $1,519,000
5
Beds
3
Baths
3,482
Sq Ft
$377/Sq Ft
Est. Value
About This Home
This home is located at 1837 Clinton Rd, Hughson, CA 95326 and is currently estimated at $1,312,747, approximately $377 per square foot. 1837 Clinton Rd is a home located in Stanislaus County with nearby schools including Hughson Elementary School, Fox Road Elementary School, and Emilie J. Ross Middle School.
Ownership History
Date
Name
Owned For
Owner Type
Purchase Details
Closed on
May 24, 2021
Sold by
Morrett Carol J
Bought by
Morrett Carol J and Morrett 2021 Trust
Current Estimated Value
Purchase Details
Closed on
Jul 9, 2013
Sold by
Morrett Carol J
Bought by
Morrett Carol J
Purchase Details
Closed on
Mar 5, 2003
Sold by
Morrett Bryan L and Morrett Carol J
Bought by
Morrett Bryan L and Morrett Carol J
Purchase Details
Closed on
Jul 18, 2000
Sold by
Graves Jonita L
Bought by
Morrett Bryan L and Morrett Carol J
Home Financials for this Owner
Home Financials are based on the most recent Mortgage that was taken out on this home.
Original Mortgage
$285,000
Outstanding Balance
$101,766
Interest Rate
8.2%
Estimated Equity
$1,210,981
Purchase Details
Closed on
Mar 27, 1997
Sold by
Graves Robert W
Bought by
Graves Johnita L
Create a Home Valuation Report for This Property
The Home Valuation Report is an in-depth analysis detailing your home's value as well as a comparison with similar homes in the area
Purchase History
| Date | Buyer | Sale Price | Title Company |
|---|---|---|---|
| Morrett Carol J | -- | None Available | |
| Morrett Carol J | -- | None Available | |
| Morrett Bryan L | -- | -- | |
| Morrett Bryan L | $192,500 | Chicago Title Co | |
| Graves Johnita L | -- | -- |
Source: Public Records
Mortgage History
| Date | Status | Borrower | Loan Amount |
|---|---|---|---|
| Open | Morrett Bryan L | $285,000 |
Source: Public Records
Tax History
| Year | Tax Paid | Tax Assessment Tax Assessment Total Assessment is a certain percentage of the fair market value that is determined by local assessors to be the total taxable value of land and additions on the property. | Land | Improvement |
|---|---|---|---|---|
| 2025 | $10,350 | $844,628 | $336,770 | $507,858 |
| 2024 | $9,727 | $828,070 | $330,167 | $497,903 |
| 2023 | $9,480 | $811,834 | $323,694 | $488,140 |
| 2022 | $8,492 | $782,439 | $317,348 | $465,091 |
| 2021 | $8,333 | $767,098 | $311,126 | $455,972 |
| 2020 | $8,211 | $759,233 | $307,936 | $451,297 |
| 2019 | $8,128 | $744,347 | $301,899 | $442,448 |
| 2018 | $7,901 | $729,752 | $295,980 | $433,772 |
| 2017 | $8,039 | $721,726 | $290,177 | $431,549 |
| 2016 | $7,576 | $707,576 | $284,488 | $423,088 |
| 2015 | $7,452 | $696,949 | $280,215 | $416,734 |
| 2014 | $7,350 | $683,298 | $274,726 | $408,572 |
Source: Public Records
Map
Nearby Homes
- 6101 Honey Haven Ln
- 6114 Honey Haven Ln
- 6117 Honey Haven Ln
- 6122 Honey Haven Ln
- 6130 Honey Haven Ln
- 6138 Honey Haven Ln
- 6143 Honey Haven Ln
- 6150 Honey Haven Ln
- 6154 Honey Haven Ln
- 6204 Honey Haven Ln
- 6200 Honey Haven Ln
- 6208 Honey Haven Ln
- 6212 Honey Haven Ln
- 1808 Apiary Way
- 6213 Honey Haven Ln
- 6216 Honey Haven Ln
- 6221 Honey Haven Ln
- 6329 Snow Beauty Way
- 6400 Snow Beauty Way
- 6400 E Hatch Rd
- 1842 Clinton Rd
- 1907 Clinton Rd
- 1936 Clinton Rd
- 1748 Clinton Rd
- 1942 Clinton Rd
- 1713 Clinton Rd
- 2001 Clinton Rd
- 2101 Clinton Rd
- 2106 Clinton Rd
- 5219 E Hatch Rd
- 5137 E Hatch Rd
- 1519 Baldwin Rd
- 5401 E Hatch Rd
- 1449 Clinton Rd
- 5101 E Hatch Rd
- 5001 E Hatch Rd
- 1421 Clinton Rd
- 5119 E Whitmore Ave
- 5519 E Hatch Rd
- 1937 Baldwin Rd
Your Personal Tour Guide
Ask me questions while you tour the home.