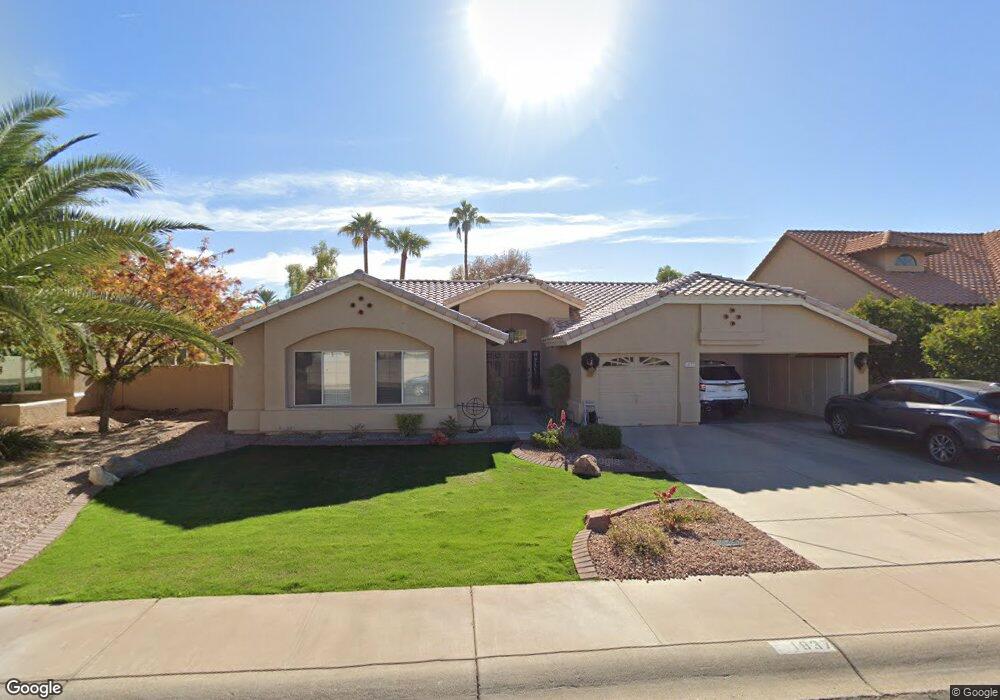
1837 E Colt Rd Tempe, AZ 85284
South Tempe NeighborhoodEstimated Value: $680,643 - $852,000
Studio
2
Baths
2,610
Sq Ft
$297/Sq Ft
Est. Value
About This Home
This home is located at 1837 E Colt Rd, Tempe, AZ 85284 and is currently estimated at $773,911, approximately $296 per square foot. 1837 E Colt Rd is a home located in Maricopa County with nearby schools including C I Waggoner School, Kyrene Middle School, and Corona Del Sol High School.
Ownership History
Date
Name
Owned For
Owner Type
Purchase Details
Closed on
Aug 16, 2022
Sold by
Steve Chu Living Trust
Bought by
Chu Steve and Chu Mary Teresa
Current Estimated Value
Purchase Details
Closed on
Jul 15, 2011
Sold by
Chu Steve
Bought by
Chu Steve and Steve Chu Living Trust
Purchase Details
Closed on
Aug 28, 1997
Sold by
Chu Kimberly Phillippe
Bought by
Chu Steve
Purchase Details
Closed on
Aug 4, 1997
Sold by
Hickok Brian L and Hickok Anita L
Bought by
Chu Steve
Purchase Details
Closed on
Apr 18, 1996
Sold by
Ratkovich Robert and Ratkovich Kathleen T
Bought by
Hickok Brian L and Hickok Anita L
Home Financials for this Owner
Home Financials are based on the most recent Mortgage that was taken out on this home.
Original Mortgage
$196,650
Interest Rate
7.82%
Mortgage Type
New Conventional
Create a Home Valuation Report for This Property
The Home Valuation Report is an in-depth analysis detailing your home's value as well as a comparison with similar homes in the area
Home Values in the Area
Average Home Value in this Area
Purchase History
| Date | Buyer | Sale Price | Title Company |
|---|---|---|---|
| Chu Steve | -- | None Listed On Document | |
| Chu Steve | -- | None Available | |
| Chu Steve | -- | Security Title Agency | |
| Chu Steve | $211,000 | Security Title Agency | |
| Hickok Brian L | $207,000 | First American Title |
Source: Public Records
Mortgage History
| Date | Status | Borrower | Loan Amount |
|---|---|---|---|
| Previous Owner | Hickok Brian L | $196,650 |
Source: Public Records
Tax History Compared to Growth
Tax History
| Year | Tax Paid | Tax Assessment Tax Assessment Total Assessment is a certain percentage of the fair market value that is determined by local assessors to be the total taxable value of land and additions on the property. | Land | Improvement |
|---|---|---|---|---|
| 2025 | $4,447 | $46,282 | -- | -- |
| 2024 | $4,173 | $44,078 | -- | -- |
| 2023 | $4,173 | $52,800 | $10,560 | $42,240 |
| 2022 | $3,951 | $40,860 | $8,170 | $32,690 |
| 2021 | $4,053 | $38,870 | $7,770 | $31,100 |
| 2020 | $3,950 | $37,500 | $7,500 | $30,000 |
| 2019 | $3,815 | $36,660 | $7,330 | $29,330 |
| 2018 | $3,681 | $34,660 | $6,930 | $27,730 |
| 2017 | $3,518 | $33,060 | $6,610 | $26,450 |
| 2016 | $3,568 | $35,010 | $7,000 | $28,010 |
| 2015 | $3,296 | $32,450 | $6,490 | $25,960 |
Source: Public Records
Map
Nearby Homes
- 1922 E Palomino Dr
- 8856 S Taylor Dr
- 8648 S Kenwood Ln
- 1938 E Calle de Caballos
- 1966 E Calle de Arcos
- 1962 E Ranch Rd Unit 3
- 1804 E Velvet Dr
- 9217 S Kachina Dr
- 8606 S Dorsey Ln
- 7715 S Alder Dr
- 1910 E Sunburst Ln
- 1975 E Sunburst Ln
- 1101 E Warner Rd Unit 117
- 2173 E La Vieve Ln
- 3947 W Roundabout Cir
- 9433 S Stanley Place
- 3763 W Park Ave
- 1129 E Knight Ln
- 7833 S Terrace Rd
- 2875 W Highland St Unit 1102
- 1831 E Colt Rd
- 1843 E Colt Rd
- 1849 E Colt Rd
- 8641 S Kachina Dr
- 8642 S Taylor Dr
- 1853 E Colt Rd
- 8633 S Kachina Dr
- 8634 S Taylor Dr
- 1903 E Colt Rd
- 8623 S Kachina Dr
- 8643 S Taylor Dr
- 8626 S Taylor Dr
- 1840 E Warner Rd
- 1911 E Colt Rd
- 8611 S Kachina Dr
- 8635 S Taylor Dr
- 8625 S Taylor Dr
- 1912 E Colt Rd
- 1912 E Colt Rd
- 1913 E Colt Rd