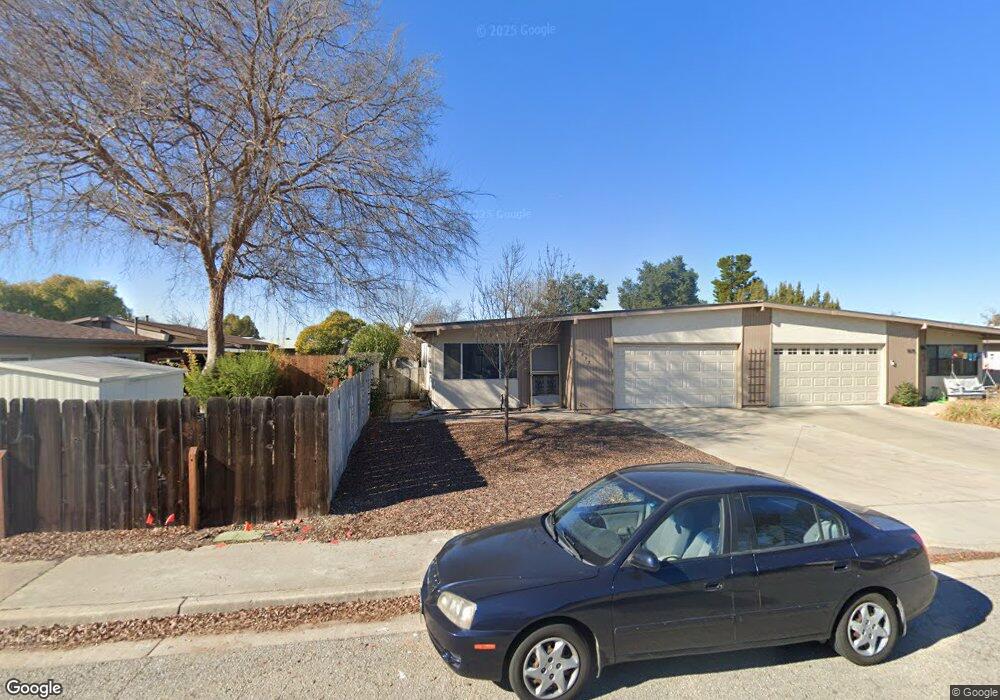
1837 Kings Dr Paso Robles, CA 93446
Estimated Value: $448,046 - $490,000
2
Beds
2
Baths
1,000
Sq Ft
$467/Sq Ft
Est. Value
About This Home
This home is located at 1837 Kings Dr, Paso Robles, CA 93446 and is currently estimated at $466,512, approximately $466 per square foot. 1837 Kings Dr is a home located in San Luis Obispo County with nearby schools including Virginia Peterson Elementary School, Daniel Lewis Middle School, and Paso Robles High School.
Ownership History
Date
Name
Owned For
Owner Type
Purchase Details
Closed on
Jun 3, 2005
Sold by
White David P and White Karen R
Bought by
White David P and White Karen R
Current Estimated Value
Purchase Details
Closed on
Feb 4, 2002
Sold by
Bradford John V
Bought by
White David P and White Karen R
Home Financials for this Owner
Home Financials are based on the most recent Mortgage that was taken out on this home.
Original Mortgage
$113,600
Outstanding Balance
$46,906
Interest Rate
7.04%
Estimated Equity
$419,606
Purchase Details
Closed on
May 24, 1995
Sold by
Hedrick Hazel M and Hedrick Revocable Livi Hazel M
Bought by
Bradford John V and Bradford Ella Mae Morse
Home Financials for this Owner
Home Financials are based on the most recent Mortgage that was taken out on this home.
Original Mortgage
$82,600
Interest Rate
7.59%
Mortgage Type
Assumption
Purchase Details
Closed on
Mar 6, 1995
Sold by
Hedrick Hazel M
Bought by
Hedrick Hazel M and Hedrick Revocable Livi Hazel M
Create a Home Valuation Report for This Property
The Home Valuation Report is an in-depth analysis detailing your home's value as well as a comparison with similar homes in the area
Purchase History
| Date | Buyer | Sale Price | Title Company |
|---|---|---|---|
| White David P | -- | -- | |
| White David P | $142,000 | Fidelity National Title Co | |
| Bradford John V | $81,000 | Chicago Title Co | |
| Hedrick Hazel M | -- | -- |
Source: Public Records
Mortgage History
| Date | Status | Borrower | Loan Amount |
|---|---|---|---|
| Open | White David P | $113,600 | |
| Previous Owner | Bradford John V | $82,600 |
Source: Public Records
Tax History
| Year | Tax Paid | Tax Assessment Tax Assessment Total Assessment is a certain percentage of the fair market value that is determined by local assessors to be the total taxable value of land and additions on the property. | Land | Improvement |
|---|---|---|---|---|
| 2025 | $2,286 | $209,753 | $96,011 | $113,742 |
| 2024 | $2,249 | $205,641 | $94,129 | $111,512 |
| 2023 | $2,249 | $201,610 | $92,284 | $109,326 |
| 2022 | $2,216 | $197,658 | $90,475 | $107,183 |
| 2021 | $2,178 | $193,783 | $88,701 | $105,082 |
| 2020 | $2,148 | $191,797 | $87,792 | $104,005 |
| 2019 | $2,118 | $188,037 | $86,071 | $101,966 |
| 2018 | $2,089 | $184,351 | $84,384 | $99,967 |
| 2017 | $1,964 | $180,737 | $82,730 | $98,007 |
| 2016 | $1,926 | $177,194 | $81,108 | $96,086 |
| 2015 | $1,918 | $174,533 | $79,890 | $94,643 |
| 2014 | $1,852 | $171,116 | $78,326 | $92,790 |
Source: Public Records
Map
Nearby Homes
- 618 Queenanne Rd
- 1834 Lark Ellen Dr
- 902 Sycamore Canyon Rd
- 1945 Fieldstone Cir
- 609 Larkfield Place
- 1728 Lark Ellen Dr
- 1744 Ponderosa Ln
- 1824 Marigold Ln
- 5185 Airport Rd
- 1607 Westfield Rd
- 614 Brookhill Dr
- 2316 Amber Grain Place
- 2314 Ashwood Place
- 1934 Tulipwood Dr
- 3731 Rosado Rd
- 3725 Rosado Rd
- 3730 Rosado Rd
- 358 Via Ramona
- 3731 Siembra Rd
- 1313 Cava Rd
- 625 Queenanne Rd
- 619 Queenanne Rd
- 629 Queenanne Rd
- 1831 Kings Dr
- 617 Queenanne Rd
- 1829 Kings Dr
- 1826 Shepherd Dr
- 533 Queenanne Rd
- 1824 Shepherd Dr
- 1819 Kings Dr
- 1838 Kings Dr
- 1818 Shepherd Dr
- 1836 Kings Dr
- 1848 Kings Dr
- 531 Queenanne Rd
- 1830 Kings Dr
- 1850 Kings Dr
- 626 Queenanne Rd
- 1828 Kings Dr
- 1816 Shepherd Dr
Your Personal Tour Guide
Ask me questions while you tour the home.