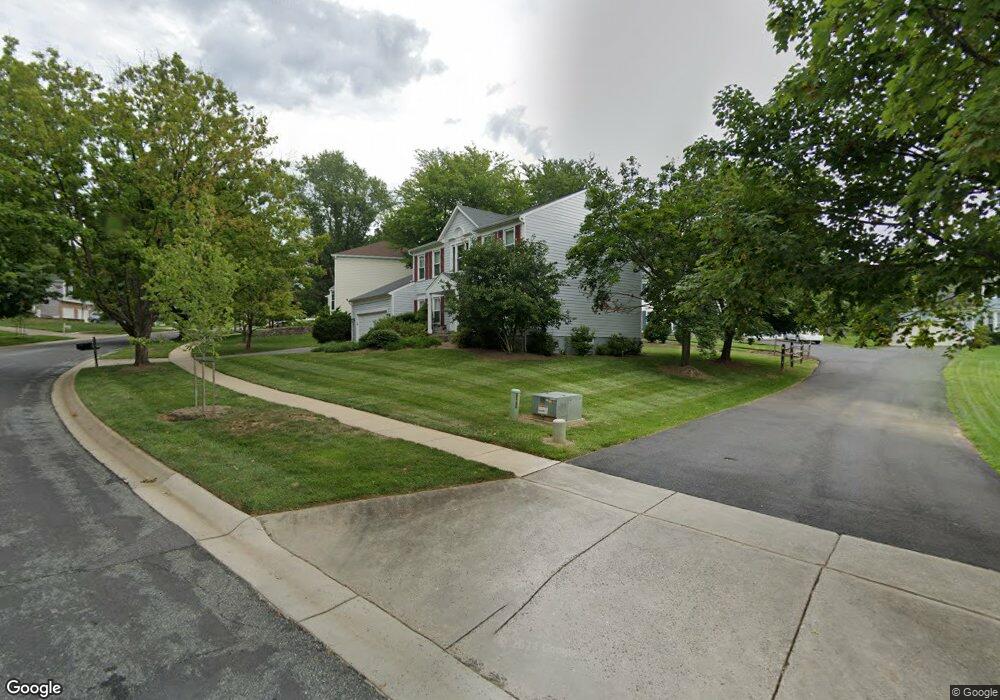
1837 Middlebridge Dr Silver Spring, MD 20906
Layhill South NeighborhoodEstimated Value: $732,000 - $784,000
4
Beds
3
Baths
2,380
Sq Ft
$318/Sq Ft
Est. Value
About This Home
This home is located at 1837 Middlebridge Dr, Silver Spring, MD 20906 and is currently estimated at $755,825, approximately $317 per square foot. 1837 Middlebridge Dr is a home located in Montgomery County with nearby schools including Glenallan Elementary School, Odessa Shannon Middle School, and John F. Kennedy High School.
Ownership History
Date
Name
Owned For
Owner Type
Purchase Details
Closed on
Apr 2, 2008
Sold by
Rosen James S
Bought by
Peterson Bradley W
Current Estimated Value
Home Financials for this Owner
Home Financials are based on the most recent Mortgage that was taken out on this home.
Original Mortgage
$408,000
Outstanding Balance
$262,865
Interest Rate
6.3%
Mortgage Type
Purchase Money Mortgage
Estimated Equity
$492,960
Purchase Details
Closed on
Mar 27, 2008
Sold by
Rosen James S
Bought by
Peterson Bradley W
Home Financials for this Owner
Home Financials are based on the most recent Mortgage that was taken out on this home.
Original Mortgage
$408,000
Outstanding Balance
$262,865
Interest Rate
6.3%
Mortgage Type
Purchase Money Mortgage
Estimated Equity
$492,960
Purchase Details
Closed on
Apr 21, 1994
Sold by
Clark M L
Bought by
Rosen James S
Home Financials for this Owner
Home Financials are based on the most recent Mortgage that was taken out on this home.
Original Mortgage
$215,900
Interest Rate
7.6%
Create a Home Valuation Report for This Property
The Home Valuation Report is an in-depth analysis detailing your home's value as well as a comparison with similar homes in the area
Home Values in the Area
Average Home Value in this Area
Purchase History
We collect this data history from publicly available records. To have your information removed, we recommend requesting removal directly through your county’s website.
| Date | Buyer | Sale Price | Title Company |
|---|---|---|---|
| Peterson Bradley W | $510,000 | -- | |
| Peterson Bradley W | $510,000 | -- | |
| Rosen James S | $239,000 | -- |
Source: Public Records
Mortgage History
We collect this data history from publicly available records. To have your information removed, we recommend requesting removal directly through your county’s website.
| Date | Status | Borrower | Loan Amount |
|---|---|---|---|
| Open | Peterson Bradley W | $408,000 | |
| Closed | Peterson Bradley W | $408,000 | |
| Previous Owner | Rosen James S | $215,900 |
Source: Public Records
Tax History
| Year | Tax Paid | Tax Assessment Tax Assessment Total Assessment is a certain percentage of the fair market value that is determined by local assessors to be the total taxable value of land and additions on the property. | Land | Improvement |
|---|---|---|---|---|
| 2025 | $7,346 | $648,200 | $194,300 | $453,900 |
| 2024 | $7,346 | $588,500 | -- | -- |
| 2023 | $5,796 | $528,800 | $0 | $0 |
| 2022 | $3,781 | $469,100 | $194,300 | $274,800 |
| 2021 | $4,848 | $459,467 | $0 | $0 |
| 2020 | $9,435 | $449,833 | $0 | $0 |
| 2019 | $4,588 | $440,200 | $194,300 | $245,900 |
| 2018 | $4,511 | $433,700 | $0 | $0 |
| 2017 | $4,545 | $427,200 | $0 | $0 |
| 2016 | $3,999 | $420,700 | $0 | $0 |
| 2015 | $3,999 | $414,867 | $0 | $0 |
| 2014 | $3,999 | $409,033 | $0 | $0 |
Source: Public Records
Map
Nearby Homes
- 13525 Winding Trail Ct
- 9 Coachlamp Ct
- 13212 Moonlight Trail Dr
- 13241 Osterport Dr
- 2105 Walking Crest Ct
- 13621 Stargazer Ln
- 1821 Briggs Rd
- 13111 Ideal Dr
- 13201 Wilton Oaks Dr
- 13422 Redspire Dr
- 13311 Hathaway Dr
- 2013 Sullivan Ln
- 13502 Windy Meadow Ln
- 13102 Hugo Place
- 1104 Sweetbay Place
- 1105 Verbena Ct
- 1108 Autumn Brook Ave
- 13105 Jingle Ln
- 1520 Ingram Terrace
- 1530 Ingram Terrace
- 1841 Middlebridge Dr
- 1833 Middlebridge Dr
- 1825 Middlebridge Dr
- 1829 Middlebridge Dr
- 13500 Winding Trail Ct
- 13501 Winding Trail Ct
- 1824 Middlebridge Dr
- 1843 Middlebridge Dr
- 13517 Stockbridge Ct
- 13513 Stockbridge Ct
- 1820 Middlebridge Dr
- 1836 Middlebridge Dr
- 13509 Stockbridge Ct
- 13505 Stockbridge Ct
- 13505 Winding Trail Ct
- 1840 Middlebridge Dr
- 13514 Winding Trail Ct
- 1816 Middlebridge Dr
- 1844 Middlebridge Dr
- 13509 Winding Trail Ct
Your Personal Tour Guide
Ask me questions while you tour the home.