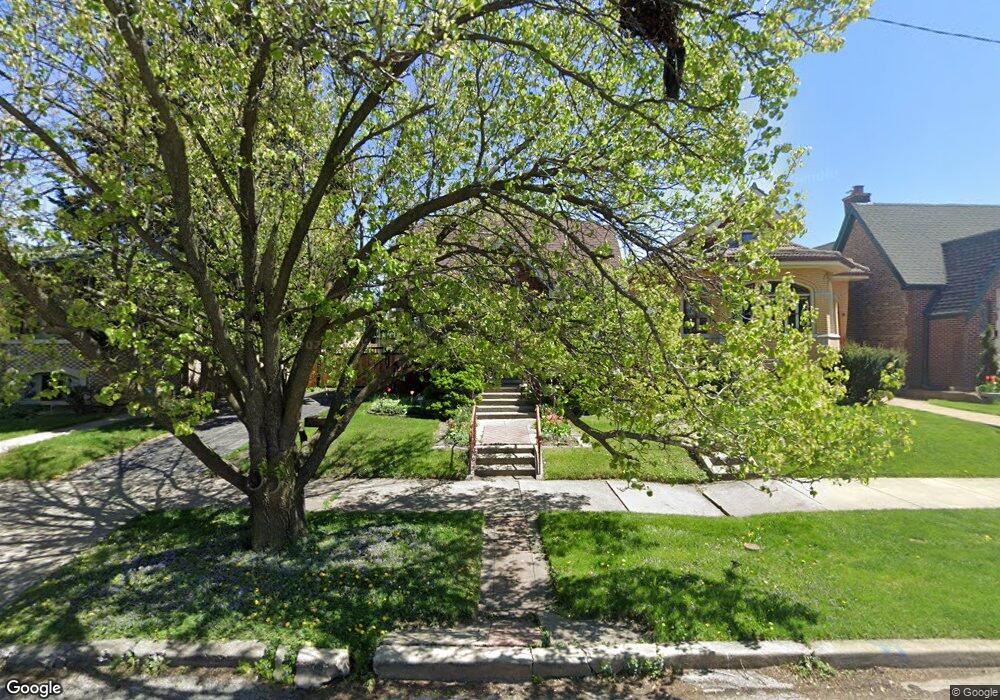
1837 N New England Ave Chicago, IL 60707
Galewood NeighborhoodEstimated Value: $405,000 - $521,000
4
Beds
3
Baths
2,563
Sq Ft
$180/Sq Ft
Est. Value
About This Home
This home is located at 1837 N New England Ave, Chicago, IL 60707 and is currently estimated at $462,357, approximately $180 per square foot. 1837 N New England Ave is a home located in Cook County with nearby schools including Sayre Elementary Language Academy, Steinmetz College Prep, and Acero - Roberto Clemente Elementary School.
Ownership History
Date
Name
Owned For
Owner Type
Purchase Details
Closed on
Sep 28, 2001
Sold by
Kizler Susan L
Bought by
Crame Fitzgerald and Crame Cynthia L
Current Estimated Value
Home Financials for this Owner
Home Financials are based on the most recent Mortgage that was taken out on this home.
Original Mortgage
$207,000
Outstanding Balance
$81,619
Interest Rate
6.99%
Estimated Equity
$380,738
Purchase Details
Closed on
Jun 26, 2001
Sold by
Kizler David V
Bought by
Kizler Susan L
Purchase Details
Closed on
Apr 15, 1994
Sold by
Menelli Concetta
Bought by
Kizler David V and Kizler Susan L
Home Financials for this Owner
Home Financials are based on the most recent Mortgage that was taken out on this home.
Original Mortgage
$108,800
Interest Rate
7.51%
Create a Home Valuation Report for This Property
The Home Valuation Report is an in-depth analysis detailing your home's value as well as a comparison with similar homes in the area
Home Values in the Area
Average Home Value in this Area
Purchase History
| Date | Buyer | Sale Price | Title Company |
|---|---|---|---|
| Crame Fitzgerald | $230,000 | Chicago Title Insurance Co | |
| Kizler Susan L | -- | -- | |
| Kizler David V | $90,666 | -- |
Source: Public Records
Mortgage History
| Date | Status | Borrower | Loan Amount |
|---|---|---|---|
| Open | Crame Fitzgerald | $207,000 | |
| Previous Owner | Kizler David V | $108,800 |
Source: Public Records
Tax History Compared to Growth
Tax History
| Year | Tax Paid | Tax Assessment Tax Assessment Total Assessment is a certain percentage of the fair market value that is determined by local assessors to be the total taxable value of land and additions on the property. | Land | Improvement |
|---|---|---|---|---|
| 2024 | $5,845 | $47,000 | $11,625 | $35,375 |
| 2023 | $5,676 | $31,000 | $9,375 | $21,625 |
| 2022 | $5,676 | $31,000 | $9,375 | $21,625 |
| 2021 | $5,567 | $31,000 | $9,375 | $21,625 |
| 2020 | $8,067 | $39,293 | $4,687 | $34,606 |
| 2019 | $8,186 | $44,150 | $4,687 | $39,463 |
| 2018 | $8,047 | $44,150 | $4,687 | $39,463 |
| 2017 | $6,863 | $35,237 | $4,125 | $31,112 |
| 2016 | $6,561 | $35,237 | $4,125 | $31,112 |
| 2015 | $5,980 | $35,237 | $4,125 | $31,112 |
| 2014 | $6,217 | $36,050 | $3,750 | $32,300 |
| 2013 | $6,083 | $36,050 | $3,750 | $32,300 |
Source: Public Records
Map
Nearby Homes
- 1941 N New England Ave
- 1916 N Rutherford Ave
- 1733 N Oak Park Ave
- 1701 N Newland Ave
- 1905 N Nordica Ave
- 1937 N Normandy Ave
- 1600 N New England Ave Unit 4
- 1700 N Natoma Ave
- 1639 N Normandy Ave
- 2054 N Nordica Ave
- 2218 N Newland Ave Unit 203
- 2037 N Harlem Ave Unit 3E
- 1930 N Harlem Ave Unit 306
- 1930 N Harlem Ave Unit 402
- 7182 W Dickens Ave Unit 2W
- 2016 N Harlem Ave Unit 7W
- 2224 N Nordica Ave
- 1227 N East Ave
- 1143 Woodbine Ave
- 1130 N Grove Ave
- 1835 N New England Ave
- 1841 N New England Ave
- 1831 N New England Ave
- 1845 N New England Ave
- 1827 N New England Ave
- 1825 N New England Ave
- 1849 N New England Ave
- 1836 N Newcastle Ave
- 1834 N Newcastle Ave
- 1840 N Newcastle Ave
- 1821 N New England Ave
- 1830 N Newcastle Ave
- 1844 N Newcastle Ave
- 1828 N Newcastle Ave
- 1855 N New England Ave
- 1848 N Newcastle Ave
- 1819 N New England Ave
- 1824 N Newcastle Ave
- 1836 N New England Ave
- 1834 N New England Ave