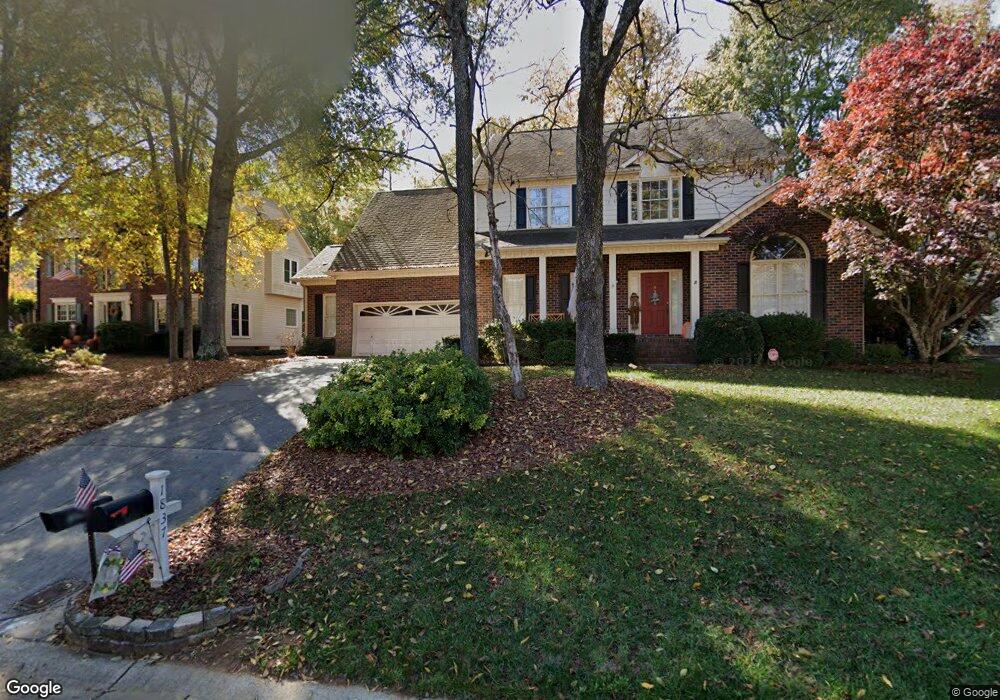
1837 Park Grove Place NW Concord, NC 28027
Estimated Value: $480,334 - $519,000
3
Beds
3
Baths
2,354
Sq Ft
$213/Sq Ft
Est. Value
About This Home
This home is located at 1837 Park Grove Place NW, Concord, NC 28027 and is currently estimated at $502,084, approximately $213 per square foot. 1837 Park Grove Place NW is a home located in Cabarrus County with nearby schools including Carl A. Furr Elementary School, Harold E. Winkler Middle School, and Dogwood Classical Academy.
Ownership History
Date
Name
Owned For
Owner Type
Purchase Details
Closed on
Dec 14, 2005
Sold by
Manley Brian V and Manley Susan A
Bought by
Pieschel H Alfred and Pieschel Margaret K
Current Estimated Value
Home Financials for this Owner
Home Financials are based on the most recent Mortgage that was taken out on this home.
Original Mortgage
$40,000
Interest Rate
5.8%
Mortgage Type
Fannie Mae Freddie Mac
Purchase Details
Closed on
Sep 16, 2003
Sold by
Kiser William H and Kiser Frieda A
Bought by
Shiloh Farms Inc
Home Financials for this Owner
Home Financials are based on the most recent Mortgage that was taken out on this home.
Original Mortgage
$350,000
Interest Rate
6.13%
Mortgage Type
Unknown
Purchase Details
Closed on
Feb 10, 1998
Sold by
Johnson Wade C and Johnson Janice H
Bought by
Richards Robert S and Richards Susan D
Purchase Details
Closed on
Oct 1, 1993
Bought by
Manley Brian and Wife Susan A
Create a Home Valuation Report for This Property
The Home Valuation Report is an in-depth analysis detailing your home's value as well as a comparison with similar homes in the area
Home Values in the Area
Average Home Value in this Area
Purchase History
| Date | Buyer | Sale Price | Title Company |
|---|---|---|---|
| Pieschel H Alfred | $238,000 | -- | |
| Shiloh Farms Inc | $345,000 | -- | |
| Richards Robert S | $2,000 | -- | |
| Manley Brian | $182,000 | -- |
Source: Public Records
Mortgage History
| Date | Status | Borrower | Loan Amount |
|---|---|---|---|
| Closed | Pieschel H Alfred | $40,000 | |
| Previous Owner | Shiloh Farms Inc | $350,000 |
Source: Public Records
Tax History Compared to Growth
Tax History
| Year | Tax Paid | Tax Assessment Tax Assessment Total Assessment is a certain percentage of the fair market value that is determined by local assessors to be the total taxable value of land and additions on the property. | Land | Improvement |
|---|---|---|---|---|
| 2025 | $4,395 | $441,230 | $100,000 | $341,230 |
| 2024 | $4,395 | $441,230 | $100,000 | $341,230 |
| 2023 | $3,521 | $288,580 | $58,000 | $230,580 |
| 2022 | $3,527 | $289,100 | $58,000 | $231,100 |
| 2021 | $3,527 | $289,100 | $58,000 | $231,100 |
| 2020 | $3,527 | $289,100 | $58,000 | $231,100 |
| 2019 | $3,048 | $249,850 | $47,000 | $202,850 |
| 2018 | $2,998 | $249,850 | $47,000 | $202,850 |
| 2017 | $2,948 | $249,850 | $47,000 | $202,850 |
| 2016 | $1,715 | $221,720 | $47,000 | $174,720 |
| 2015 | $2,616 | $221,720 | $47,000 | $174,720 |
| 2014 | $2,616 | $221,720 | $47,000 | $174,720 |
Source: Public Records
Map
Nearby Homes
- 5612 Meadow Bluff Ct NW
- 1735 Park Grove Place NW
- 5711 Monticello Dr NW
- 5619 Weddington Rd
- 5811 Monticello Dr NW
- 5807 Monticello Dr NW
- 4769 Covington Dr NW
- 5820 Wingate Way NW
- 1507 Chadmore Ln NW
- 4760 Lauren Glen St NW
- 4731 Asherton Place NW
- 4803 Chesney St NW
- 1231 Bennington Dr NW
- 4940 Weddington Rd NW
- 4831 Turnridge Ct NW
- 4827 Chesney St NW
- 4835 Chesney St NW
- 1337 Braeburn Rd NW
- 888 Craigmont Ln NW
- 159 Pitts School Rd NW
- 1833 Park Grove Place NW
- 1841 Park Grove Place NW
- 5606 Meadow Bluff Ct NW
- 1829 Park Grove Place NW
- 1838 Park Grove Place NW
- 1845 Park Grove Place NW
- 1834 Park Grove Place NW
- 1842 Park Grove Place NW
- 5600 Meadow Bluff Ct NW
- 1830 Park Grove Place NW
- 1825 Park Grove Place NW
- 1846 Park Grove Place NW
- 1826 Park Grove Place NW
- 5530 Monticello Dr NW
- 1849 Park Grove Place NW
- 5520 Monticello Dr NW
- 5601 Meadow Bluff Ct NW
- 1821 Park Grove Place NW
- 5540 Monticello Dr NW
- 5616 Meadow Bluff Ct NW