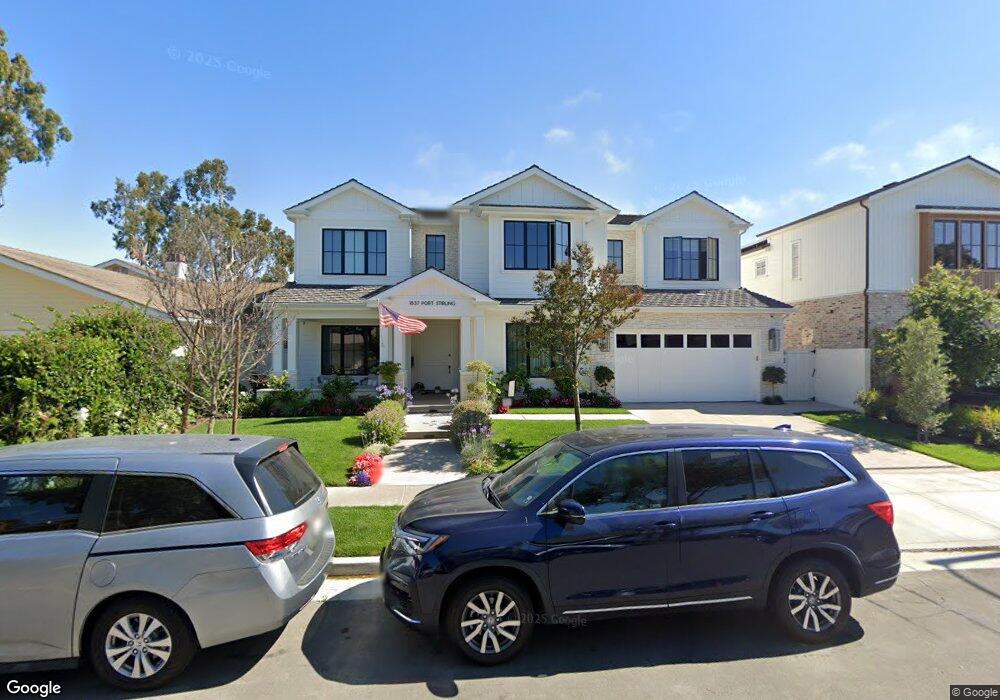
1837 Port Stirling Place Newport Beach, CA 92660
Harbor View Homes NeighborhoodEstimated Value: $7,687,354 - $8,104,000
5
Beds
7
Baths
4,785
Sq Ft
$1,662/Sq Ft
Est. Value
About This Home
This home is located at 1837 Port Stirling Place, Newport Beach, CA 92660 and is currently estimated at $7,951,339, approximately $1,661 per square foot. 1837 Port Stirling Place is a home located in Orange County with nearby schools including Roy O. Andersen Elementary School, Corona del Mar Middle and High School, and Del Mar Lincoln Child Development Center.
Ownership History
Date
Name
Owned For
Owner Type
Purchase Details
Closed on
Jan 16, 2020
Sold by
Mayo Alvin F and Mayo Nanette
Bought by
Close Matthew W and Close Tristan N Reyes
Current Estimated Value
Home Financials for this Owner
Home Financials are based on the most recent Mortgage that was taken out on this home.
Original Mortgage
$4,499,500
Outstanding Balance
$3,907,328
Interest Rate
2.75%
Mortgage Type
New Conventional
Estimated Equity
$4,044,011
Purchase Details
Closed on
Sep 15, 2017
Sold by
Mcgeachy Joan Ellen and Mcgeachy John Brian
Bought by
Mayo Alvin F and Mayo Nanette
Purchase Details
Closed on
Jul 17, 2017
Sold by
Mcgeachy Carol Ann and Joan John
Bought by
Joan John and Mcgeachy Jeffrey
Purchase Details
Closed on
Nov 11, 1998
Sold by
Mcgeachy Carol Ann
Bought by
Mcgeachy Carol Ann and Carol Ann Mcgeachy Trust
Create a Home Valuation Report for This Property
The Home Valuation Report is an in-depth analysis detailing your home's value as well as a comparison with similar homes in the area
Home Values in the Area
Average Home Value in this Area
Purchase History
| Date | Buyer | Sale Price | Title Company |
|---|---|---|---|
| Close Matthew W | $5,000,000 | Orange Coast Title | |
| Mayo Alvin F | $2,100,000 | Orange Coast Title Co | |
| Joan John | -- | None Available | |
| Mcgeachy Carol Ann | -- | -- |
Source: Public Records
Mortgage History
| Date | Status | Borrower | Loan Amount |
|---|---|---|---|
| Open | Close Matthew W | $4,499,500 |
Source: Public Records
Tax History Compared to Growth
Tax History
| Year | Tax Paid | Tax Assessment Tax Assessment Total Assessment is a certain percentage of the fair market value that is determined by local assessors to be the total taxable value of land and additions on the property. | Land | Improvement |
|---|---|---|---|---|
| 2025 | $56,729 | $5,468,229 | $3,689,198 | $1,779,031 |
| 2024 | $56,729 | $5,361,009 | $3,616,860 | $1,744,149 |
| 2023 | $55,404 | $5,255,892 | $3,545,942 | $1,709,950 |
| 2022 | $54,491 | $5,152,836 | $3,476,414 | $1,676,422 |
| 2021 | $53,442 | $5,051,800 | $3,408,249 | $1,643,551 |
| 2020 | $39,074 | $3,677,023 | $2,056,400 | $1,620,623 |
| 2019 | $28,377 | $2,664,914 | $2,016,079 | $648,835 |
| 2018 | $22,424 | $2,100,000 | $1,976,549 | $123,451 |
| 2017 | $1,814 | $138,925 | $56,900 | $82,025 |
| 2016 | $1,777 | $136,201 | $55,784 | $80,417 |
| 2015 | $1,758 | $134,156 | $54,946 | $79,210 |
| 2014 | $1,717 | $131,529 | $53,870 | $77,659 |
Source: Public Records
Map
Nearby Homes
- 1845 Port Westbourne Place
- 1812 Port Margate Place
- 5 Hillsborough
- 1977 Port Cardiff Place
- 17 Monaco Unit 12
- 1935 Port Bishop Place
- 1736 Port Sheffield Place
- 29 Augusta Ln
- 15 Cypress Point Ln
- 1707 Newport Hills Dr W
- 1808 Newport Hills Dr E
- 15 Boardwalk
- 1 Cypress Point Ln
- 1917 Yacht Colinia
- 58 Victoria
- 2001 Yacht Resolute
- 56 Royal Saint George Rd
- 515 Bay Hill Dr
- 10 Seabluff
- 11 Montpellier Unit 22
- 1843 Port Stirling Place
- 1831 Port Stirling Place
- 1825 Port Stirling Place
- 1820 Port Seabourne Way
- 1828 Port Seabourne Way
- 1814 Port Seabourne Way
- 1836 Port Stirling Place
- 1842 Port Stirling Place
- 1830 Port Stirling Place
- 1819 Port Stirling Place
- 1808 Port Seabourne Way
- 1824 Port Stirling Place
- 1809 Port Stirling Place
- 1818 Port Stirling Place
- 1839 Port Ashley Place
- 1845 Port Ashley Place
- 1833 Port Ashley Place
- 1800 Port Seabourne Way
- 1827 Port Ashley Place
- 1812 Port Stirling Place