1837 Sheri Ann Cir Unit 415 San Jose, CA 95131
McKay - Ringwood NeighborhoodEstimated Value: $1,003,000 - $1,410,000
3
Beds
3
Baths
1,790
Sq Ft
$701/Sq Ft
Est. Value
About This Home
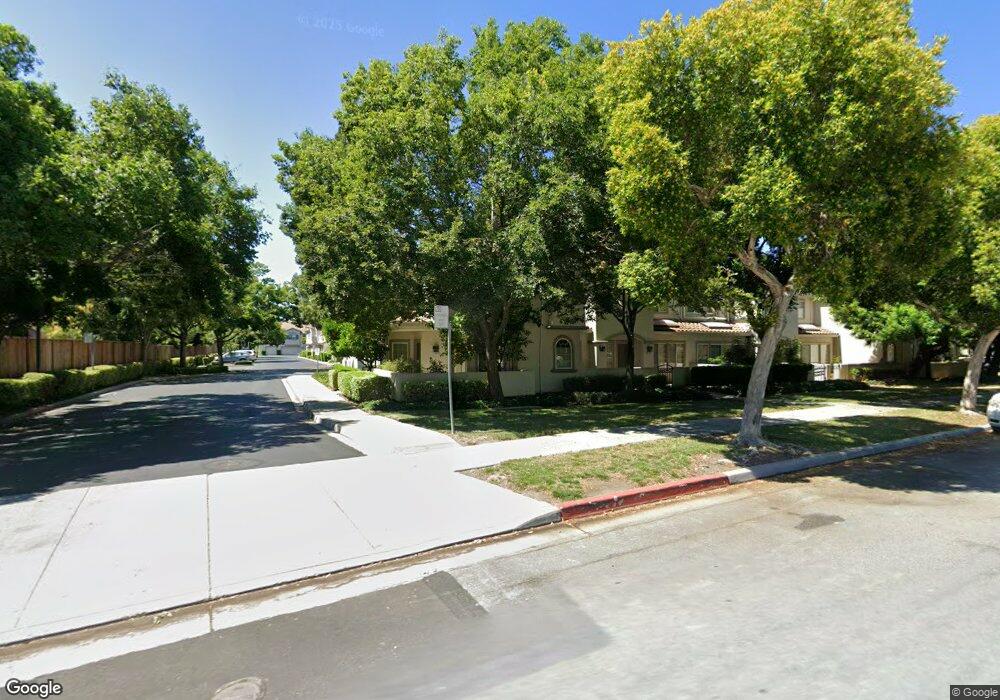
This home is located at 1837 Sheri Ann Cir Unit 415, San Jose, CA 95131 and is currently estimated at $1,254,954, approximately $701 per square foot. 1837 Sheri Ann Cir Unit 415 is a home located in Santa Clara County with nearby schools including Orchard Elementary School, Independence High School, and Challenger School - Berryessa.
Ownership History
Date
Name
Owned For
Owner Type
Purchase Details
Closed on
Sep 2, 2004
Sold by
Micevic Mladen
Bought by
Micevic Mladen and Vlahovic Tatjana
Current Estimated Value
Purchase Details
Closed on
Jun 18, 2004
Sold by
Vlahovic Tatjana
Bought by
Micevic Mladen
Home Financials for this Owner
Home Financials are based on the most recent Mortgage that was taken out on this home.
Original Mortgage
$415,600
Outstanding Balance
$194,529
Interest Rate
5.37%
Mortgage Type
Purchase Money Mortgage
Estimated Equity
$1,060,425
Purchase Details
Closed on
Jun 16, 2004
Sold by
Horton Janice S
Bought by
Micevic Mladen
Home Financials for this Owner
Home Financials are based on the most recent Mortgage that was taken out on this home.
Original Mortgage
$415,600
Outstanding Balance
$194,529
Interest Rate
5.37%
Mortgage Type
Purchase Money Mortgage
Estimated Equity
$1,060,425
Create a Home Valuation Report for This Property
The Home Valuation Report is an in-depth analysis detailing your home's value as well as a comparison with similar homes in the area
Home Values in the Area
Average Home Value in this Area
Purchase History
| Date | Buyer | Sale Price | Title Company |
|---|---|---|---|
| Micevic Mladen | -- | Stewart Title Of Ca Inc | |
| Micevic Mladen | -- | Stewart Title Of California | |
| Micevic Mladen | $519,500 | Stewart Title Of California |
Source: Public Records
Mortgage History
| Date | Status | Borrower | Loan Amount |
|---|---|---|---|
| Open | Micevic Mladen | $415,600 |
Source: Public Records
Tax History Compared to Growth
Tax History
| Year | Tax Paid | Tax Assessment Tax Assessment Total Assessment is a certain percentage of the fair market value that is determined by local assessors to be the total taxable value of land and additions on the property. | Land | Improvement |
|---|---|---|---|---|
| 2025 | $9,501 | $738,603 | $426,531 | $312,072 |
| 2024 | $9,501 | $724,121 | $418,168 | $305,953 |
| 2023 | $9,306 | $709,923 | $409,969 | $299,954 |
| 2022 | $9,268 | $696,004 | $401,931 | $294,073 |
| 2021 | $9,133 | $682,357 | $394,050 | $288,307 |
| 2020 | $8,943 | $675,361 | $390,010 | $285,351 |
| 2019 | $8,792 | $662,119 | $382,363 | $279,756 |
| 2018 | $8,703 | $649,137 | $374,866 | $274,271 |
| 2017 | $8,575 | $636,410 | $367,516 | $268,894 |
| 2016 | $8,106 | $623,932 | $360,310 | $263,622 |
| 2015 | $8,050 | $614,561 | $354,898 | $259,663 |
| 2014 | $7,798 | $602,524 | $347,947 | $254,577 |
Source: Public Records
Map
Nearby Homes
- 1287 Marcello Dr
- 1437 Marcello Dr
- 1788 Camino Leonor
- 314 Morning Star Dr Unit 38
- 324 Morning Star Dr Unit 43
- 1070 Bramblewood Ln
- 1087 Bigleaf Place Unit 105
- 1087 Bigleaf Place Unit 108
- 1068 Bigleaf Place Unit 402
- 981 Cassia Place
- 1057 Foxglove Place Unit 202
- 0 Lundy Ave
- 1399 Meadow Ridge Cir
- 1441 Rocklin Ct Unit 112
- 1827 Flickinger Ave
- 1612 Parkview Green Cir
- 900 Golden Wheel Park Dr Unit 29
- 900 Golden Wheel Park Dr Unit 66
- 900 Golden Wheel Unit 67
- 1767 Clove Ct
- 1835 Sheri Ann Cir Unit 414
- 1839 Sheri Ann Cir
- 1833 Sheri Ann Cir
- 1831 Sheri Ann Cir
- 1095 Mckay Dr
- 1093 Mckay Dr
- 1829 Sheri Ann Cir
- 1827 Sheri Ann Cir Unit 421
- 1091 Mckay Dr
- 1896 Wayne Cir
- 1087 Mckay Dr
- 1089 Mckay Dr
- 1375 Tea Rose Cir Unit 611
- 1902 Wayne Cir
- 1825 Sheri Ann Cir
- 1844 Sheri Ann Cir
- 1371 Tea Rose Cir Unit 612
- 1842 Sheri Ann Cir Unit 324
- 1367 Tea Rose Cir Unit 613
- 1363 Tea Rose Cir