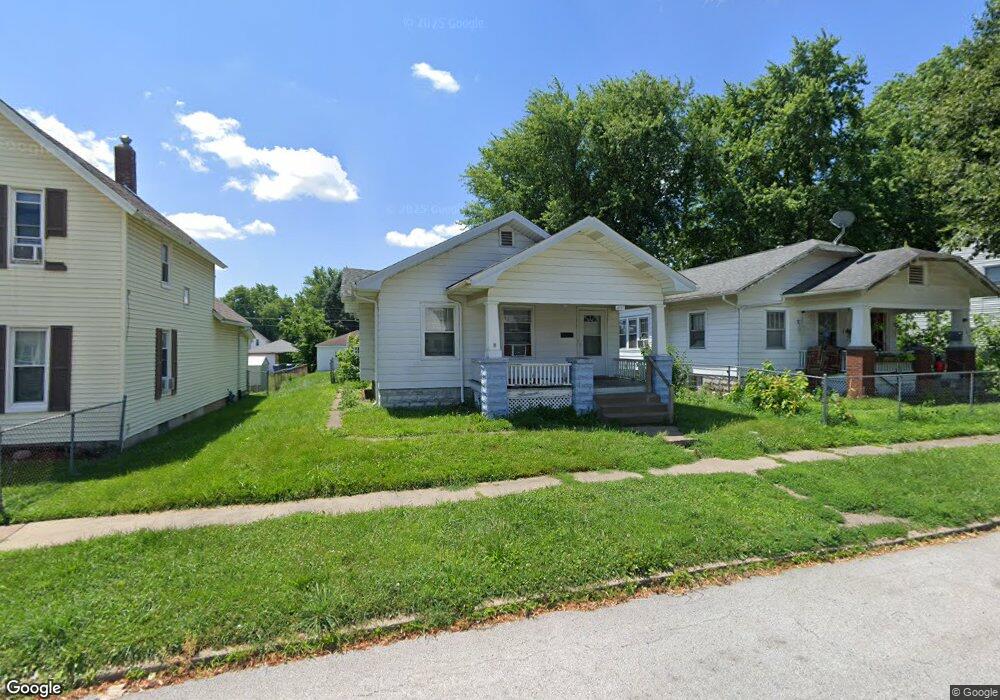
1837 W 8th St Davenport, IA 52802
Fejervary NeighborhoodEstimated Value: $88,000 - $105,956
2
Beds
1
Bath
986
Sq Ft
$99/Sq Ft
Est. Value
About This Home
This home is located at 1837 W 8th St, Davenport, IA 52802 and is currently estimated at $97,739, approximately $99 per square foot. 1837 W 8th St is a home located in Scott County with nearby schools including Walnut Hill Elementary School, South Christian Elementary School, and Wilson Elementary School.
Ownership History
Date
Name
Owned For
Owner Type
Purchase Details
Closed on
Nov 17, 2022
Sold by
Qc Res Llc
Bought by
Avila Amy
Current Estimated Value
Home Financials for this Owner
Home Financials are based on the most recent Mortgage that was taken out on this home.
Original Mortgage
$65,625
Outstanding Balance
$63,586
Interest Rate
6.94%
Mortgage Type
New Conventional
Estimated Equity
$34,153
Purchase Details
Closed on
Oct 8, 2021
Sold by
Burns Jesse T and Burns Megan L
Bought by
Qc Res Llc
Home Financials for this Owner
Home Financials are based on the most recent Mortgage that was taken out on this home.
Original Mortgage
$65,000
Interest Rate
2.8%
Mortgage Type
Credit Line Revolving
Purchase Details
Closed on
Aug 6, 2018
Sold by
Gg Holdings Llc
Bought by
Burns Jesse and Burns Megan
Home Financials for this Owner
Home Financials are based on the most recent Mortgage that was taken out on this home.
Original Mortgage
$45,758
Interest Rate
4.6%
Purchase Details
Closed on
Dec 27, 2013
Sold by
Gullickson Group Real Estate Llc
Bought by
Gg Holdings Llc
Purchase Details
Closed on
Mar 30, 2005
Sold by
Jaresa Properties Llc
Bought by
Gullickson Group Real Estate Llc
Create a Home Valuation Report for This Property
The Home Valuation Report is an in-depth analysis detailing your home's value as well as a comparison with similar homes in the area
Home Values in the Area
Average Home Value in this Area
Purchase History
| Date | Buyer | Sale Price | Title Company |
|---|---|---|---|
| Avila Amy | $87,500 | None Listed On Document | |
| Qc Res Llc | -- | None Listed On Document | |
| Burns Jesse | -- | -- | |
| Gg Holdings Llc | -- | None Available | |
| Gullickson Group Real Estate Llc | $45,000 | None Available |
Source: Public Records
Mortgage History
| Date | Status | Borrower | Loan Amount |
|---|---|---|---|
| Open | Avila Amy | $65,625 | |
| Previous Owner | Qc Res Llc | $65,000 | |
| Previous Owner | Burns Jesse | $45,758 | |
| Previous Owner | Burns Jesse | -- |
Source: Public Records
Tax History Compared to Growth
Tax History
| Year | Tax Paid | Tax Assessment Tax Assessment Total Assessment is a certain percentage of the fair market value that is determined by local assessors to be the total taxable value of land and additions on the property. | Land | Improvement |
|---|---|---|---|---|
| 2025 | $1,316 | $84,250 | $10,130 | $74,120 |
| 2024 | $1,284 | $73,660 | $10,130 | $63,530 |
| 2023 | $1,589 | $73,660 | $10,130 | $63,530 |
| 2022 | $1,689 | $69,180 | $7,200 | $61,980 |
| 2021 | $1,376 | $64,150 | $7,200 | $56,950 |
| 2020 | $1,394 | $64,150 | $7,200 | $56,950 |
| 2019 | $1,330 | $59,250 | $7,200 | $52,050 |
| 2018 | $1,234 | $59,250 | $7,200 | $52,050 |
| 2017 | $1,278 | $56,190 | $7,200 | $48,990 |
| 2016 | $1,230 | $56,190 | $0 | $0 |
| 2015 | $1,230 | $52,890 | $0 | $0 |
| 2014 | $1,174 | $52,890 | $0 | $0 |
| 2013 | $1,154 | $0 | $0 | $0 |
| 2012 | -- | $62,010 | $6,790 | $55,220 |
Source: Public Records
Map
Nearby Homes