18377 Dunbury Cir Farmington, MN 55024
Estimated Value: $514,000 - $541,795
4
Beds
3
Baths
2,546
Sq Ft
$208/Sq Ft
Est. Value
About This Home
This home is located at 18377 Dunbury Cir, Farmington, MN 55024 and is currently estimated at $530,699, approximately $208 per square foot. 18377 Dunbury Cir is a home located in Dakota County with nearby schools including Akin Road Elementary School, Levi P. Dodge Middle School, and Farmington High School.
Ownership History
Date
Name
Owned For
Owner Type
Purchase Details
Closed on
Dec 9, 2021
Sold by
Nistler Mark A and Nistler Catherine A
Bought by
True Sterling and Nelson Kellie
Current Estimated Value
Home Financials for this Owner
Home Financials are based on the most recent Mortgage that was taken out on this home.
Original Mortgage
$436,590
Outstanding Balance
$401,548
Interest Rate
3.11%
Mortgage Type
New Conventional
Estimated Equity
$129,151
Purchase Details
Closed on
Oct 6, 2017
Sold by
Bots Helen S
Bought by
Nistler Mark A and Nistler Catherine E
Home Financials for this Owner
Home Financials are based on the most recent Mortgage that was taken out on this home.
Original Mortgage
$279,000
Interest Rate
3.83%
Mortgage Type
New Conventional
Purchase Details
Closed on
Jul 16, 2010
Sold by
Mattamy Minneapolis Pa
Bought by
Bots John R and Bots Helen S
Create a Home Valuation Report for This Property
The Home Valuation Report is an in-depth analysis detailing your home's value as well as a comparison with similar homes in the area
Home Values in the Area
Average Home Value in this Area
Purchase History
| Date | Buyer | Sale Price | Title Company |
|---|---|---|---|
| True Sterling | $485,100 | Minnesota Title | |
| Nistler Mark A | $368,000 | On-Site Title Llc | |
| Bots John R | $302,446 | -- |
Source: Public Records
Mortgage History
| Date | Status | Borrower | Loan Amount |
|---|---|---|---|
| Open | True Sterling | $436,590 | |
| Previous Owner | Nistler Mark A | $279,000 |
Source: Public Records
Tax History Compared to Growth
Tax History
| Year | Tax Paid | Tax Assessment Tax Assessment Total Assessment is a certain percentage of the fair market value that is determined by local assessors to be the total taxable value of land and additions on the property. | Land | Improvement |
|---|---|---|---|---|
| 2024 | $5,868 | $466,000 | $119,500 | $346,500 |
| 2023 | $5,868 | $481,900 | $119,800 | $362,100 |
| 2022 | $5,548 | $457,600 | $119,500 | $338,100 |
| 2021 | $5,284 | $390,500 | $103,900 | $286,600 |
| 2020 | $5,430 | $370,500 | $98,900 | $271,600 |
| 2019 | $5,403 | $365,800 | $94,200 | $271,600 |
| 2018 | $5,262 | $357,400 | $101,500 | $255,900 |
| 2017 | $5,317 | $338,500 | $96,700 | $241,800 |
| 2016 | $5,322 | $332,300 | $92,000 | $240,300 |
| 2015 | $4,914 | $315,375 | $86,667 | $228,708 |
| 2014 | -- | $306,764 | $80,482 | $226,282 |
| 2013 | -- | $270,031 | $71,363 | $198,668 |
Source: Public Records
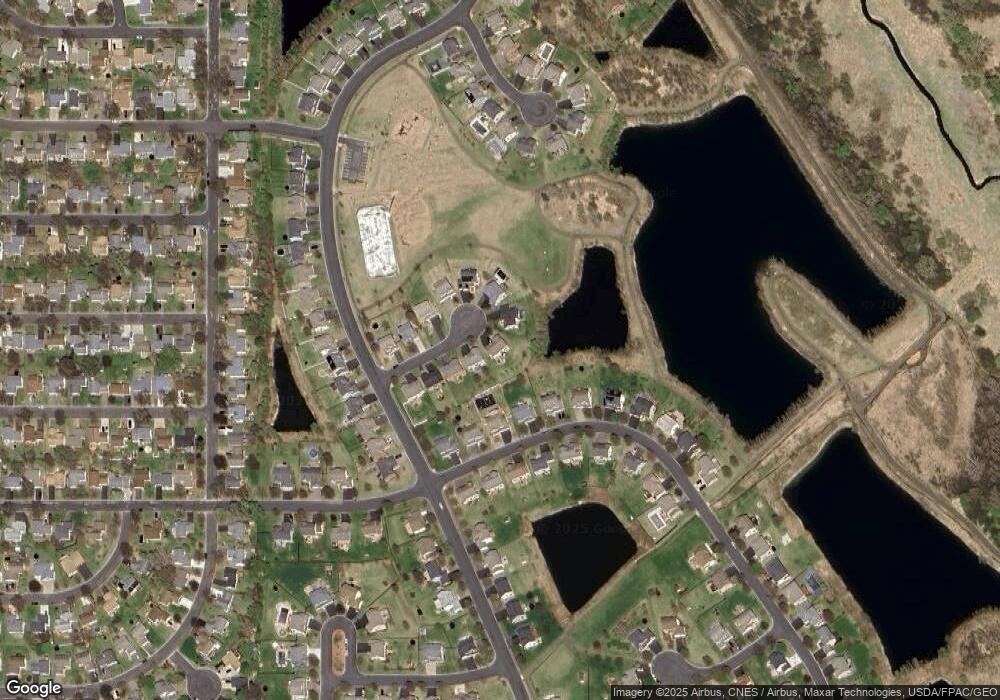
Map
Nearby Homes
- 18285 Dunbury Ave
- 18231 Elkwood Ave
- 18681 Dulaney Dr
- 17895 Eclipse Ave
- 18932 Dunbury Ave
- 17811 Ellsworth Dr
- 17836 Ellsworth Dr
- 17795 Ellsworth Dr
- 17812 Ellsworth Dr
- 17763 Ellsworth Dr
- 17747 Ellsworth Dr
- Sierra Plan at Pheasant Run - Villas
- Clifton Plan at Pheasant Run - Villas
- 18400 Euclid St Unit 362
- 4750 190th St W
- 17772 Ellsworth Dr
- 17759 Embers Ave
- 5412 188th St W
- 17518 Driscoll Place
- 17522 Driscoll Place
- 18351 Dunbury Cir
- 18385 Dunbury Cir
- 18338 Duluth St
- 18335 Dunbury Cir
- 18350 Duluth St
- 18326 Duluth St
- 18390 Dunbury Cir
- 18319 Dunbury Cir
- 18314 Duluth St
- 18362 Duluth St
- 18372 Dunbury Cir
- 18336 Dunbury Cir
- 18354 Dunberry Cir
- 18303 Dunbury Cir
- 18318 Dunbury Cir
- 18302 Duluth St
- 18374 Duluth St
- 18300 Dunbury Cir
- 18343 Duluth St
- 18351 Duluth St