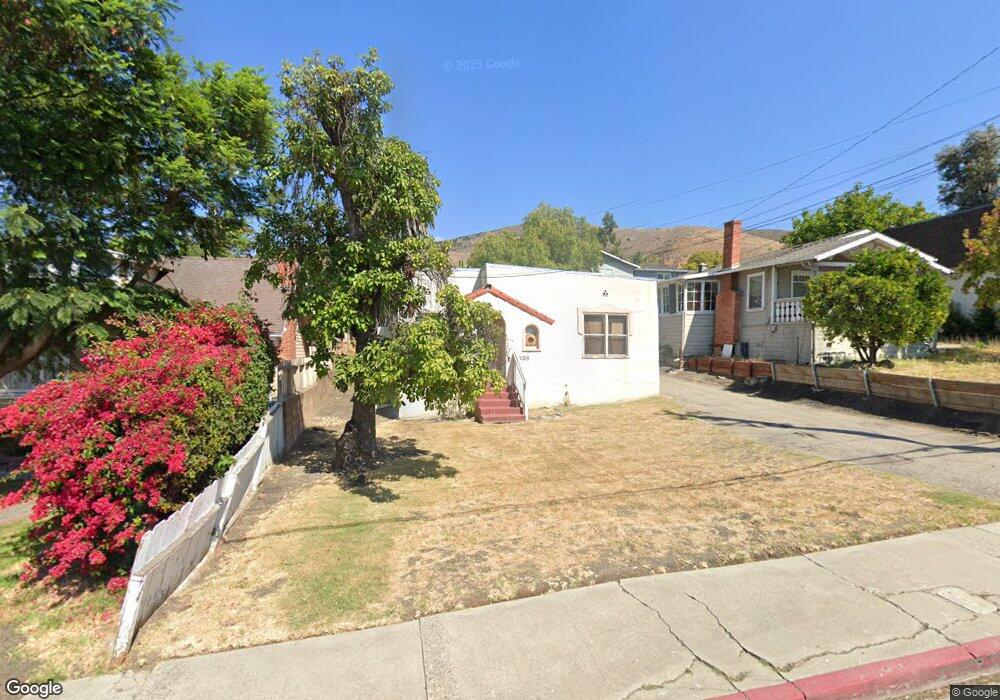
1838 Johnson Ave San Luis Obispo, CA 93401
Woodland Drive NeighborhoodEstimated Value: $771,559 - $923,000
3
Beds
1
Bath
--
Sq Ft
7,797
Sq Ft Lot
About This Home
This home is located at 1838 Johnson Ave, San Luis Obispo, CA 93401 and is currently estimated at $856,140. 1838 Johnson Ave is a home located in San Luis Obispo County with nearby schools including Bishop's Peak Elementary School, Laguna Middle School, and San Luis Obispo High School.
Ownership History
Date
Name
Owned For
Owner Type
Purchase Details
Closed on
Jun 10, 2016
Sold by
Cryden Rostovsky Margaret E and Rostovsky Margaret Ellen
Bought by
Rostovsky Margaret E Cryden and The Margaret E Cryden Rostovsk
Current Estimated Value
Purchase Details
Closed on
Jan 21, 2015
Sold by
Rostovsky Margaret E Cryden and Rostovsky Margaret Ellen
Bought by
Rostovsky Margaret E Cryden and The Margaret E Cryden Rostovsk
Purchase Details
Closed on
Oct 13, 2006
Sold by
Cryden David W
Bought by
Cryden David W and Cryden Separate Proper David W
Purchase Details
Closed on
Dec 28, 1995
Sold by
Rabb Maxwell M and Rabb Ruth
Bought by
Rabb Family Partnership Lp
Purchase Details
Closed on
Jul 5, 1995
Sold by
Rabb Ruth
Bought by
Rabb Maxwell M and Rabb Ruth
Purchase Details
Closed on
Apr 23, 1995
Sold by
Rabb Ruth
Bought by
Rabb Maxwell M and Rabb Ruth
Create a Home Valuation Report for This Property
The Home Valuation Report is an in-depth analysis detailing your home's value as well as a comparison with similar homes in the area
Home Values in the Area
Average Home Value in this Area
Purchase History
| Date | Buyer | Sale Price | Title Company |
|---|---|---|---|
| Rostovsky Margaret E Cryden | -- | None Available | |
| Rostovsky Margaret E Cryden | -- | None Available | |
| Cryden David W | -- | None Available | |
| Rabb Family Partnership Lp | -- | -- | |
| Rabb Maxwell M | -- | -- | |
| Rabb Maxwell M | -- | -- |
Source: Public Records
Tax History Compared to Growth
Tax History
| Year | Tax Paid | Tax Assessment Tax Assessment Total Assessment is a certain percentage of the fair market value that is determined by local assessors to be the total taxable value of land and additions on the property. | Land | Improvement |
|---|---|---|---|---|
| 2025 | $2,245 | $207,232 | $132,531 | $74,701 |
| 2024 | $2,205 | $203,170 | $129,933 | $73,237 |
| 2023 | $2,205 | $199,187 | $127,386 | $71,801 |
| 2022 | $2,067 | $195,283 | $124,889 | $70,394 |
| 2021 | $2,034 | $191,455 | $122,441 | $69,014 |
| 2020 | $2,013 | $189,493 | $121,186 | $68,307 |
| 2019 | $1,992 | $185,778 | $118,810 | $66,968 |
| 2018 | $1,953 | $182,136 | $116,481 | $65,655 |
| 2017 | $1,915 | $178,566 | $114,198 | $64,368 |
| 2016 | $1,877 | $175,065 | $111,959 | $63,106 |
| 2015 | $1,849 | $172,437 | $110,278 | $62,159 |
| 2014 | $1,697 | $169,060 | $108,118 | $60,942 |
Source: Public Records
Map
Nearby Homes
- 1771 Johnson Ave
- 1443 Iris St
- 1697 Fixlini St
- 2052 Johnson Ave
- 2085 Fixlini St
- 1263 Pismo St
- 1075 Ella St Unit 3
- 1010 Church St
- 1700 Osos St
- 1079 Pauline Way
- 2406 Johnson Ave
- 1328 Morro St Unit 130
- 880 Buchon St
- 1437 Smith St
- 1308 Monterey St Unit 340
- 1304 Sydney St
- 1536 Garden St
- 2375 Boulevard Del Campo
- 879 Johnson Ave
- 2516 Greta Place
- 1828 Johnson Ave
- 1840 Johnson Ave
- 1822 Johnson Ave
- 1453 Lizzie St
- 1850 Johnson Ave Unit 6
- 1850 Johnson Ave
- 1460 Iris St
- 1469 Lizzie St
- 1867 Fixlini St
- 1474 Iris St
- 1875 Fixlini St
- 1780 Johnson Ave
- 1831 Fixlini St
- 17 Lizzie St
- 20 Lizzie St
- 1760 Johnson Ave
- 1442 Lizzie St
- 1916 Johnson Ave
- 1439 Iris St
- 1441 Iris St