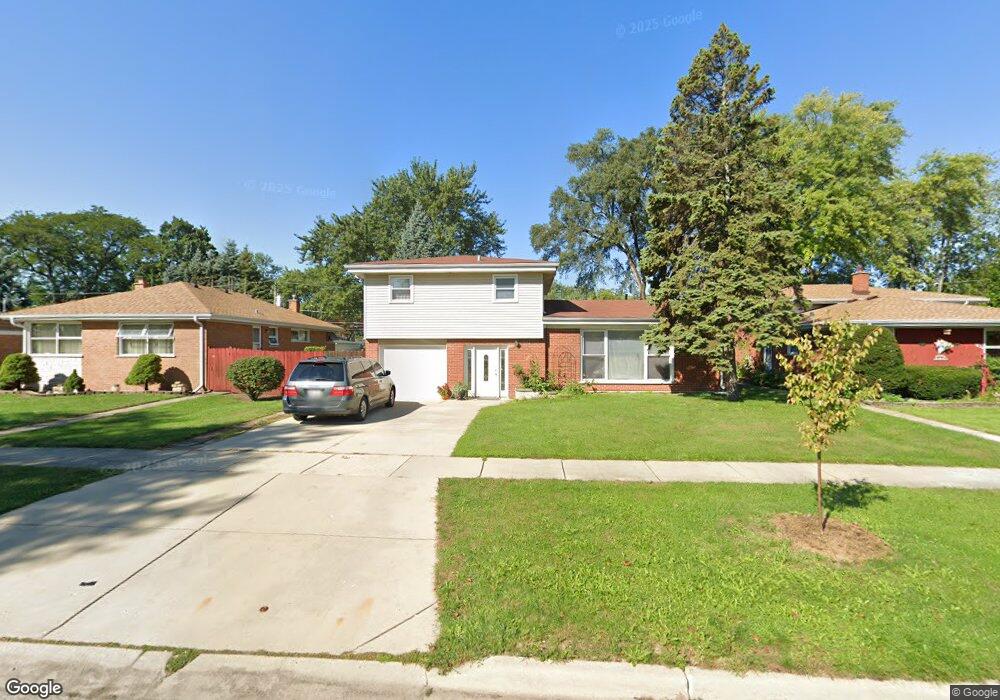
1838 Locust St Unit B Des Plaines, IL 60018
Estimated Value: $381,000 - $493,000
3
Beds
2
Baths
1,494
Sq Ft
$285/Sq Ft
Est. Value
About This Home
This home is located at 1838 Locust St Unit B, Des Plaines, IL 60018 and is currently estimated at $426,376, approximately $285 per square foot. 1838 Locust St Unit B is a home located in Cook County with nearby schools including South Elementary School, Algonquin Middle School, and Maine West High School.
Ownership History
Date
Name
Owned For
Owner Type
Purchase Details
Closed on
Oct 18, 2007
Sold by
Soltys Nataliya
Bought by
Soltys Nataliya and Soltis Nikolai
Current Estimated Value
Purchase Details
Closed on
Mar 11, 2001
Sold by
Soltys Nikolai and Soltys Nataliya
Bought by
Soltys Nataliya
Home Financials for this Owner
Home Financials are based on the most recent Mortgage that was taken out on this home.
Original Mortgage
$169,000
Outstanding Balance
$62,596
Interest Rate
7.25%
Estimated Equity
$363,780
Purchase Details
Closed on
Oct 23, 2000
Sold by
Kariotakis George and Kariotakis Anastasia
Bought by
Soltys Nikolai and Soltys Nataliya
Home Financials for this Owner
Home Financials are based on the most recent Mortgage that was taken out on this home.
Original Mortgage
$167,600
Interest Rate
8.37%
Create a Home Valuation Report for This Property
The Home Valuation Report is an in-depth analysis detailing your home's value as well as a comparison with similar homes in the area
Home Values in the Area
Average Home Value in this Area
Purchase History
| Date | Buyer | Sale Price | Title Company |
|---|---|---|---|
| Soltys Nataliya | -- | Cambridge Title Company | |
| Soltys Nataliya | -- | Lawyers Title Insurance Corp | |
| Soltys Nikolai | $209,500 | Chicago Title Insurance Co |
Source: Public Records
Mortgage History
| Date | Status | Borrower | Loan Amount |
|---|---|---|---|
| Open | Soltys Nataliya | $169,000 | |
| Closed | Soltys Nikolai | $167,600 |
Source: Public Records
Tax History Compared to Growth
Tax History
| Year | Tax Paid | Tax Assessment Tax Assessment Total Assessment is a certain percentage of the fair market value that is determined by local assessors to be the total taxable value of land and additions on the property. | Land | Improvement |
|---|---|---|---|---|
| 2024 | $5,789 | $25,272 | $5,940 | $19,332 |
| 2023 | $5,623 | $25,272 | $5,940 | $19,332 |
| 2022 | $5,623 | $25,272 | $5,940 | $19,332 |
| 2021 | $6,204 | $23,513 | $4,950 | $18,563 |
| 2020 | $6,168 | $23,513 | $4,950 | $18,563 |
| 2019 | $6,187 | $26,420 | $4,950 | $21,470 |
| 2018 | $5,302 | $21,164 | $4,356 | $16,808 |
| 2017 | $5,226 | $21,164 | $4,356 | $16,808 |
| 2016 | $5,187 | $21,164 | $4,356 | $16,808 |
| 2015 | $6,713 | $24,827 | $3,762 | $21,065 |
| 2014 | $6,587 | $24,827 | $3,762 | $21,065 |
| 2013 | $6,406 | $24,827 | $3,762 | $21,065 |
Source: Public Records
Map
Nearby Homes
- 1928 Kennicott Ct
- 1721 Linden St
- 1640 S River Rd
- 1536 Orchard St
- 1724 Illinois St
- 1689 S Elm St
- 1632 S Elm St
- 2017 Pine St Unit B
- 1700 E Forest Ave
- 1706 Buckingham Dr
- 1641 E Touhy Ave
- 1278 E River Dr
- 1629 E Touhy Ave
- 1783 Lee St
- 2500 Maple St
- 38 E Touhy Ave
- 1966 Laura Ln
- 1489 E Algonquin Rd
- 2609 Eisenhower Dr
- 2646 Maple St
- 1830 Locust St
- 1844 Locust St
- 1854 Locust St Unit B
- 1820 Locust St
- 1839 Maple St
- 1831 Maple St
- 1845 Maple St
- 1860 Locust St
- 1855 Maple St Unit B
- 1823 Maple St Unit 305
- 1823 Maple St
- 1843 Locust St
- 1831 Locust St
- 1811 Everett Ave
- 1861 Maple St
- 1855 Locust St
- 1823 Locust St Unit B
- 1866 Locust St
- 1863 Locust St
- 1865 Everett Ave