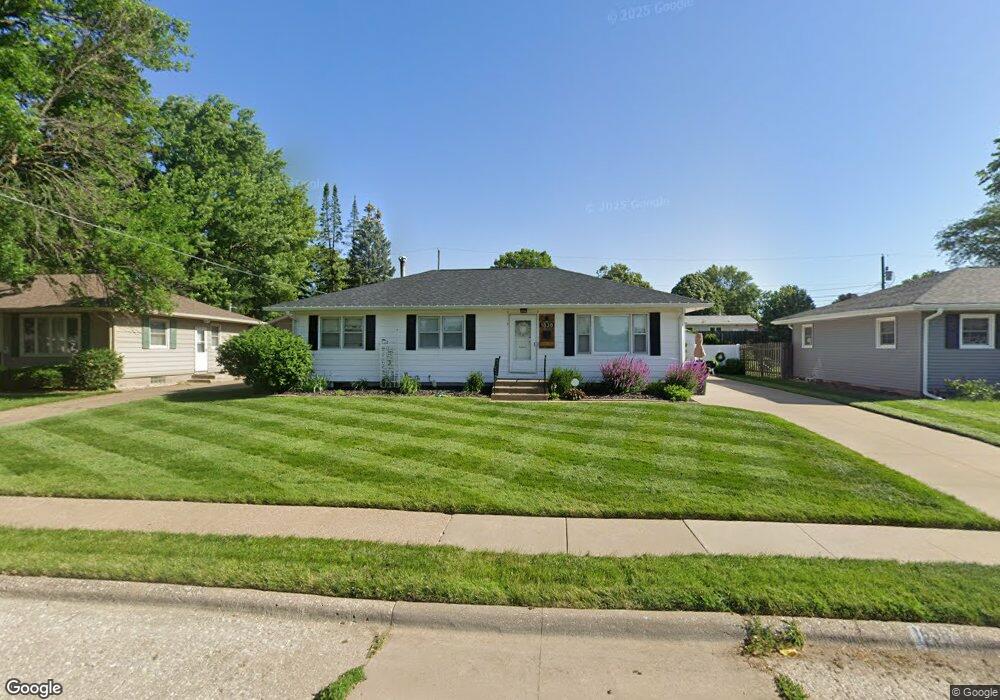
1838 W 37th St Davenport, IA 52806
Northwest Davenport NeighborhoodEstimated Value: $176,211 - $213,000
3
Beds
3
Baths
1,288
Sq Ft
$151/Sq Ft
Est. Value
About This Home
This home is located at 1838 W 37th St, Davenport, IA 52806 and is currently estimated at $194,803, approximately $151 per square foot. 1838 W 37th St is a home located in Scott County with nearby schools including Tygart Creek Elementary School, South Christian Elementary School, and Adams Elementary School.
Ownership History
Date
Name
Owned For
Owner Type
Purchase Details
Closed on
Jul 25, 2018
Sold by
Michael C Fuller Ret
Bought by
Paustian Wade A and Fuller Rachel L
Current Estimated Value
Home Financials for this Owner
Home Financials are based on the most recent Mortgage that was taken out on this home.
Original Mortgage
$63,500
Outstanding Balance
$55,032
Interest Rate
4.5%
Mortgage Type
New Conventional
Estimated Equity
$139,771
Purchase Details
Closed on
Oct 7, 2010
Sold by
Fuller Michael C and Fuller Cathy M
Bought by
Fuller Michael C and Fuller Cathy M
Purchase Details
Closed on
Mar 14, 2006
Sold by
The Estate Of Vera B Rohlf
Bought by
Mcf Family Revocable Trust
Home Financials for this Owner
Home Financials are based on the most recent Mortgage that was taken out on this home.
Original Mortgage
$84,750
Interest Rate
6.38%
Mortgage Type
New Conventional
Create a Home Valuation Report for This Property
The Home Valuation Report is an in-depth analysis detailing your home's value as well as a comparison with similar homes in the area
Home Values in the Area
Average Home Value in this Area
Purchase History
| Date | Buyer | Sale Price | Title Company |
|---|---|---|---|
| Paustian Wade A | $135,000 | -- | |
| Fuller Michael C | -- | None Available | |
| Mcf Family Revocable Trust | $113,000 | None Available |
Source: Public Records
Mortgage History
| Date | Status | Borrower | Loan Amount |
|---|---|---|---|
| Open | Paustian Wade A | $63,500 | |
| Previous Owner | Mcf Family Revocable Trust | $84,750 |
Source: Public Records
Tax History Compared to Growth
Tax History
| Year | Tax Paid | Tax Assessment Tax Assessment Total Assessment is a certain percentage of the fair market value that is determined by local assessors to be the total taxable value of land and additions on the property. | Land | Improvement |
|---|---|---|---|---|
| 2025 | $2,548 | $182,800 | $27,440 | $155,360 |
| 2024 | $3,182 | $152,750 | $27,440 | $125,310 |
| 2023 | $3,090 | $152,750 | $27,440 | $125,310 |
| 2022 | $2,996 | $142,360 | $24,010 | $118,350 |
| 2021 | $2,720 | $135,680 | $24,010 | $111,670 |
| 2020 | $2,800 | $131,860 | $24,010 | $107,850 |
| 2019 | $2,999 | $124,230 | $24,010 | $100,220 |
| 2018 | $2,624 | $124,230 | $24,010 | $100,220 |
| 2017 | $2,789 | $119,450 | $24,010 | $95,440 |
| 2016 | $2,512 | $114,680 | $0 | $0 |
| 2015 | $2,512 | $114,250 | $0 | $0 |
| 2014 | $2,538 | $114,250 | $0 | $0 |
| 2013 | $2,494 | $0 | $0 | $0 |
| 2012 | -- | $118,180 | $26,120 | $92,060 |
Source: Public Records
Map
Nearby Homes
- 3612 Wilkes Ave
- Lot 29 W 34th St
- 1617 W 38th St
- 2159 W 35th St
- 4132 Rodeo Rd
- 3831 N Sturdevant St
- 2223 W 34th St
- 1517 W Kimberly Rd
- 3433 Washington St
- 3205 N Pine St
- 1453 W 41st St
- 4406 Regency Place
- 2149 W 30th St
- 2222 W 30th St
- 4104 N Linwood Ave
- 4123 N Linwood Ave
- 3011 N Pine St
- 1344 W 37th St
- 3812 N Thornwood Ave
- 1336 W 38th Place