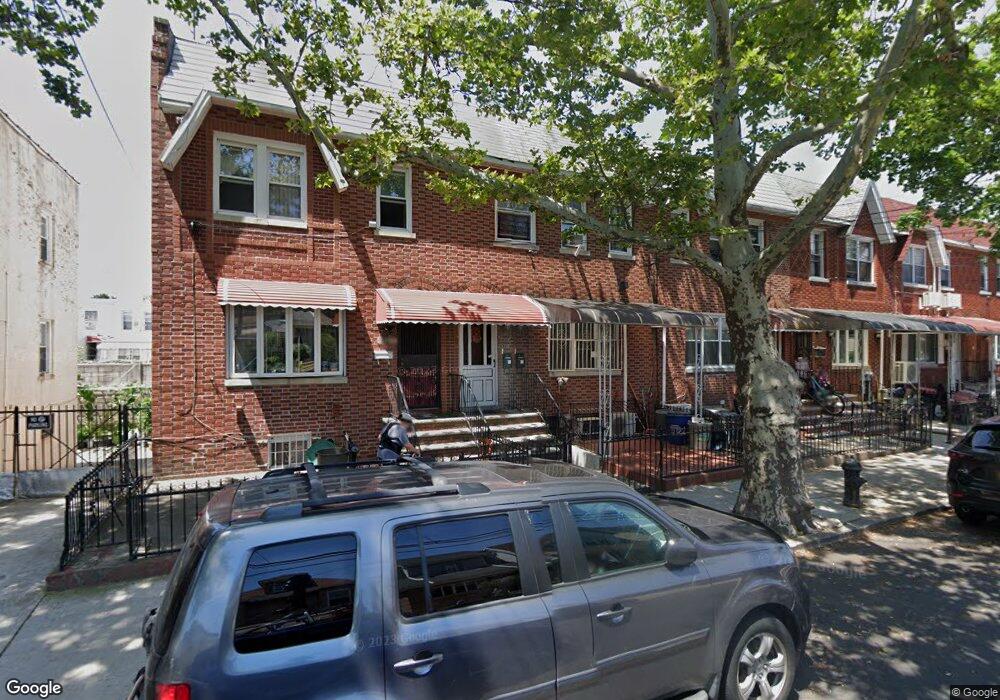
1838 W 7th St Brooklyn, NY 11223
Gravesend NeighborhoodEstimated Value: $950,122 - $1,203,000
--
Bed
--
Bath
1,728
Sq Ft
$642/Sq Ft
Est. Value
About This Home
This home is located at 1838 W 7th St, Brooklyn, NY 11223 and is currently estimated at $1,108,781, approximately $641 per square foot. 1838 W 7th St is a home located in Kings County with nearby schools including P.S. 97 - The Highlawn, Is 228 David A Boody, and Hebrew Language Academy Charter 2.
Ownership History
Date
Name
Owned For
Owner Type
Purchase Details
Closed on
Jun 11, 2012
Sold by
Mauro Elia
Bought by
Wong Jessica Chong and Zhong Jinghui
Current Estimated Value
Home Financials for this Owner
Home Financials are based on the most recent Mortgage that was taken out on this home.
Original Mortgage
$180,000
Outstanding Balance
$124,453
Interest Rate
3.78%
Mortgage Type
New Conventional
Estimated Equity
$984,328
Purchase Details
Closed on
Jan 25, 2007
Sold by
Mirarchi Ferdinando
Bought by
Mauro Elia and Mirarchi-Manetto Pina
Create a Home Valuation Report for This Property
The Home Valuation Report is an in-depth analysis detailing your home's value as well as a comparison with similar homes in the area
Home Values in the Area
Average Home Value in this Area
Purchase History
| Date | Buyer | Sale Price | Title Company |
|---|---|---|---|
| Wong Jessica Chong | $538,000 | -- | |
| Mauro Elia | -- | -- |
Source: Public Records
Mortgage History
| Date | Status | Borrower | Loan Amount |
|---|---|---|---|
| Open | Wong Jessica Chong | $180,000 |
Source: Public Records
Tax History Compared to Growth
Tax History
| Year | Tax Paid | Tax Assessment Tax Assessment Total Assessment is a certain percentage of the fair market value that is determined by local assessors to be the total taxable value of land and additions on the property. | Land | Improvement |
|---|---|---|---|---|
| 2025 | $6,304 | $68,100 | $7,320 | $60,780 |
| 2024 | $6,304 | $61,920 | $7,320 | $54,600 |
| 2023 | $6,025 | $62,580 | $7,320 | $55,260 |
| 2022 | $5,664 | $65,280 | $7,320 | $57,960 |
| 2021 | $5,971 | $59,460 | $7,320 | $52,140 |
| 2020 | $2,895 | $47,880 | $7,320 | $40,560 |
| 2019 | $5,471 | $47,880 | $7,320 | $40,560 |
| 2018 | $5,039 | $24,721 | $4,422 | $20,299 |
| 2017 | $4,820 | $23,644 | $4,144 | $19,500 |
| 2016 | $4,727 | $23,644 | $4,486 | $19,158 |
| 2015 | $2,471 | $23,064 | $6,590 | $16,474 |
| 2014 | $2,471 | $21,795 | $7,466 | $14,329 |
Source: Public Records
Map
Nearby Homes