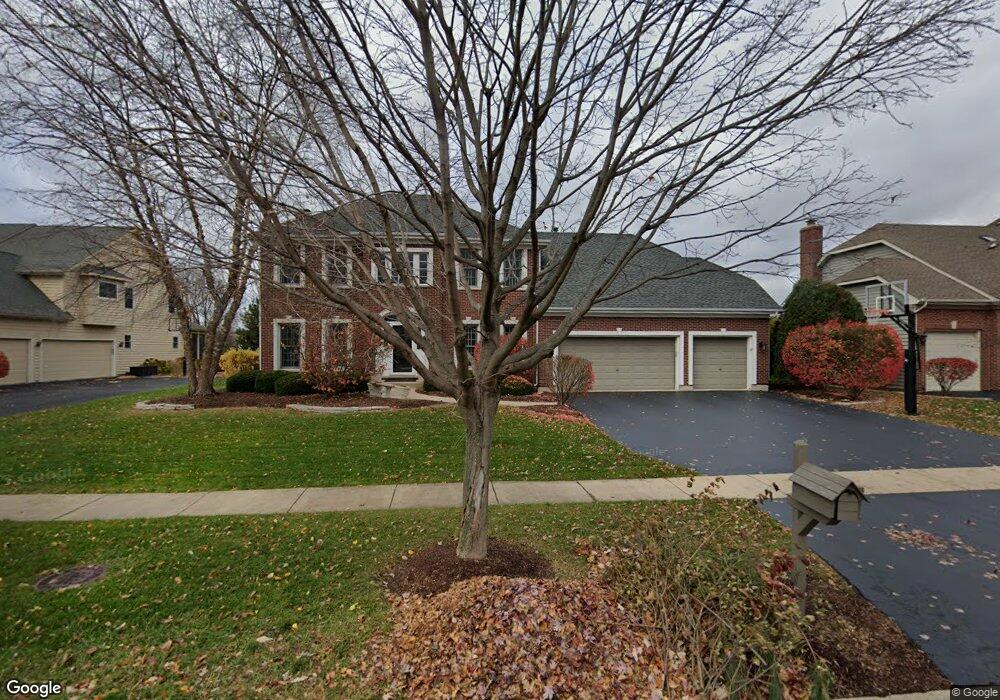
1839 Eldorado Dr Geneva, IL 60134
Eagle Brook NeighborhoodEstimated Value: $704,000 - $811,000
4
Beds
4
Baths
2,701
Sq Ft
$276/Sq Ft
Est. Value
About This Home
This home is located at 1839 Eldorado Dr, Geneva, IL 60134 and is currently estimated at $746,492, approximately $276 per square foot. 1839 Eldorado Dr is a home located in Kane County with nearby schools including Western Avenue Elementary School, Geneva Community High School, and St. Peter School.
Ownership History
Date
Name
Owned For
Owner Type
Purchase Details
Closed on
Feb 16, 2002
Sold by
Blauwiekel Nicholas K and Blauwiekel Debra K
Bought by
Cendant Mobility Financial Corp
Current Estimated Value
Home Financials for this Owner
Home Financials are based on the most recent Mortgage that was taken out on this home.
Original Mortgage
$279,200
Interest Rate
6.34%
Purchase Details
Closed on
Jan 29, 2002
Sold by
Cendant Mobility Financial Corp
Bought by
Abel Jeffrey and Abel Lisa
Home Financials for this Owner
Home Financials are based on the most recent Mortgage that was taken out on this home.
Original Mortgage
$279,200
Interest Rate
6.34%
Purchase Details
Closed on
Aug 24, 2001
Sold by
Lasalle Bank National Assn
Bought by
Blauwiekel Nicholas L and Blauwiekel Debra K
Home Financials for this Owner
Home Financials are based on the most recent Mortgage that was taken out on this home.
Original Mortgage
$240,000
Interest Rate
6.62%
Create a Home Valuation Report for This Property
The Home Valuation Report is an in-depth analysis detailing your home's value as well as a comparison with similar homes in the area
Home Values in the Area
Average Home Value in this Area
Purchase History
| Date | Buyer | Sale Price | Title Company |
|---|---|---|---|
| Cendant Mobility Financial Corp | $410,000 | -- | |
| Abel Jeffrey | $349,000 | First American Title Co | |
| Blauwiekel Nicholas L | $402,000 | Chicago Title Insurance Co |
Source: Public Records
Mortgage History
| Date | Status | Borrower | Loan Amount |
|---|---|---|---|
| Previous Owner | Abel Jeffrey | $279,200 | |
| Previous Owner | Blauwiekel Nicholas L | $240,000 |
Source: Public Records
Tax History
| Year | Tax Paid | Tax Assessment Tax Assessment Total Assessment is a certain percentage of the fair market value that is determined by local assessors to be the total taxable value of land and additions on the property. | Land | Improvement |
|---|---|---|---|---|
| 2024 | $15,371 | $207,605 | $65,561 | $142,044 |
| 2023 | $14,919 | $188,732 | $59,601 | $129,131 |
| 2022 | $14,233 | $175,369 | $55,381 | $119,988 |
| 2021 | $13,826 | $168,852 | $53,323 | $115,529 |
| 2020 | $13,672 | $166,275 | $52,509 | $113,766 |
| 2019 | $13,639 | $163,127 | $51,515 | $111,612 |
| 2018 | $13,309 | $159,564 | $51,515 | $108,049 |
| 2017 | $13,165 | $155,308 | $50,141 | $105,167 |
| 2016 | $13,232 | $153,209 | $49,463 | $103,746 |
| 2015 | -- | $145,664 | $47,027 | $98,637 |
| 2014 | -- | $136,643 | $47,027 | $89,616 |
| 2013 | -- | $136,643 | $47,027 | $89,616 |
Source: Public Records
Map
Nearby Homes
- 839 S Randall Rd
- Unit 6A Prairie Grove Dr
- Unit 5B Prairie Grove Dr
- Unit 4A Prairie Grove Dr
- Unit 5A Prairie Grove Dr
- Unit 7A Prairie Grove Dr
- Unit 6C Prairie Grove Dr
- Unit 5C Prairie Grove Dr
- Unit 6B Prairie Grove Dr
- Unit 4C Prairie Grove Dr
- Unit 7C Prairie Grove Dr
- 1145 Keim Ct
- 2782 Miller Rd
- 2685 Cedar Ave
- 2250 South St
- 1949 Gary Ln
- 2300 Kaneville Rd
- 1580 Turnberry Ct
- 369 Fritz Ln
- 655 Blackhawk Dr
- 1849 Eldorado Dr
- 1829 Eldorado Dr
- 1859 Eldorado Dr
- 1819 Eldorado Dr
- 1840 Eldorado Dr
- 1830 Eldorado Dr Unit 4
- 1820 Eldorado Dr
- 1850 Eldorado Dr
- 1869 Eldorado Dr
- 1860 Eldorado Dr
- Lot 1 Easton Ave
- Lot 1 Elizabeth Place
- 0N413 Old Kirk Rd
- 99 Confidential St
- 1N254 Lafox Rd
- ON423 King Dr
- 000 W Confidential St
- 999 Confidential Ave
- 999 W Confidential St
- 9999 Confidential Rd
Your Personal Tour Guide
Ask me questions while you tour the home.