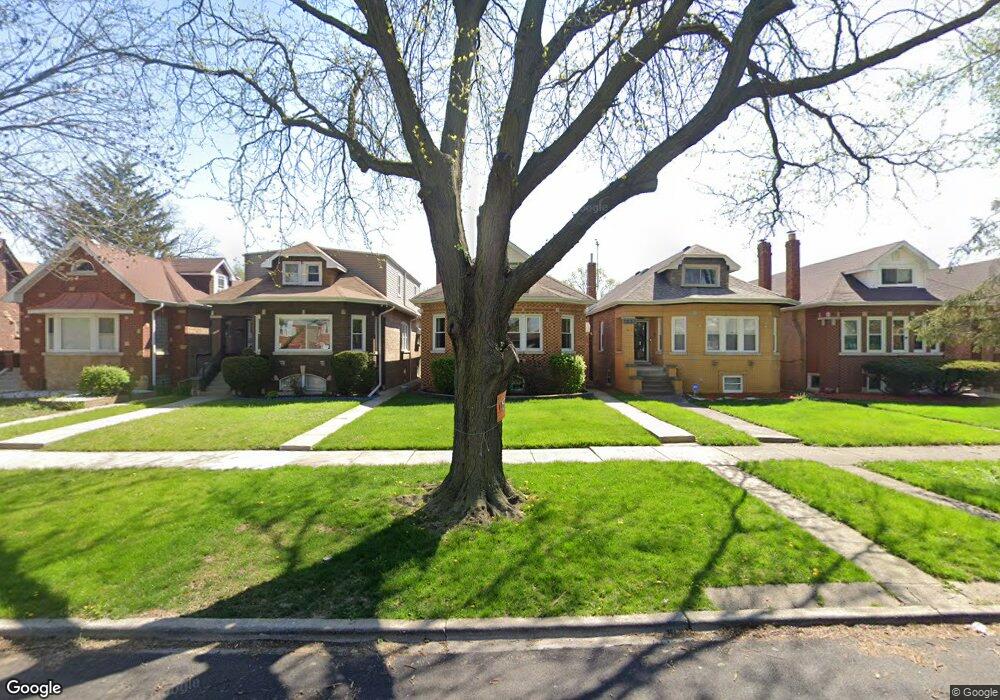
1839 N Nagle Ave Chicago, IL 60707
Galewood NeighborhoodEstimated Value: $339,000 - $407,000
4
Beds
2
Baths
1,143
Sq Ft
$323/Sq Ft
Est. Value
About This Home
This home is located at 1839 N Nagle Ave, Chicago, IL 60707 and is currently estimated at $369,093, approximately $322 per square foot. 1839 N Nagle Ave is a home located in Cook County with nearby schools including Lovett Elementary School, Steinmetz College Prep, and Acero - Roberto Clemente Elementary School.
Ownership History
Date
Name
Owned For
Owner Type
Purchase Details
Closed on
May 23, 2019
Sold by
Drain Milton
Bought by
Drain Judy R
Current Estimated Value
Purchase Details
Closed on
Apr 20, 1999
Sold by
R & Z Enterprises Inc
Bought by
Division Partners Inc
Purchase Details
Closed on
Mar 29, 1999
Sold by
The Bank Of New York
Bought by
R & Z Enterprises Inc
Create a Home Valuation Report for This Property
The Home Valuation Report is an in-depth analysis detailing your home's value as well as a comparison with similar homes in the area
Home Values in the Area
Average Home Value in this Area
Purchase History
| Date | Buyer | Sale Price | Title Company |
|---|---|---|---|
| Drain Judy R | -- | None Available | |
| Division Partners Inc | -- | -- | |
| R & Z Enterprises Inc | $90,000 | -- |
Source: Public Records
Tax History Compared to Growth
Tax History
| Year | Tax Paid | Tax Assessment Tax Assessment Total Assessment is a certain percentage of the fair market value that is determined by local assessors to be the total taxable value of land and additions on the property. | Land | Improvement |
|---|---|---|---|---|
| 2024 | $4,156 | $29,000 | $15,496 | $13,504 |
| 2023 | $4,029 | $23,000 | $11,694 | $11,306 |
| 2022 | $4,029 | $23,000 | $11,694 | $11,306 |
| 2021 | $3,958 | $23,000 | $11,694 | $11,306 |
| 2020 | $4,535 | $23,447 | $6,473 | $16,974 |
| 2019 | $4,607 | $26,345 | $6,473 | $19,872 |
| 2018 | $4,528 | $26,345 | $6,473 | $19,872 |
| 2017 | $4,401 | $23,807 | $5,696 | $18,111 |
| 2016 | $4,271 | $23,807 | $5,696 | $18,111 |
| 2015 | $3,884 | $23,807 | $5,696 | $18,111 |
| 2014 | $3,531 | $21,587 | $5,179 | $16,408 |
| 2013 | $3,450 | $21,587 | $5,179 | $16,408 |
Source: Public Records
Map
Nearby Homes
- 1627 N Narragansett Ave
- 1937 N Normandy Ave
- 1700 N Natoma Ave
- 1639 N Normandy Ave
- 1221 Edmer Ave
- 1227 N East Ave
- 1733 N Oak Park Ave
- 1212 N Harvey Ave
- 1715 N Meade Ave
- 1221 Hayes Ave
- 1122 N Ridgeland Ave
- 1104 Fair Oaks Ave
- 1618 N Mcvicker Ave
- 1625 N Mcvicker Ave
- 102 Le Moyne Pkwy
- 2311 N Natchez Ave
- 2119 N Mcvicker Ave
- 1657 N Austin Ave
- 34 Le Moyne Pkwy
- 1701 N Newland Ave
- 1843 N Nagle Ave
- 1837 N Nagle Ave
- 1845 N Nagle Ave
- 1833 N Nagle Ave
- 1849 N Nagle Ave
- 1831 N Nagle Ave
- 1851 N Nagle Ave
- 1827 N Nagle Ave
- 1825 N Nagle Ave
- 1855 N Nagle Ave
- 1857 N Nagle Ave
- 1838 N Narragansett Ave
- 1836 N Narragansett Ave
- 1842 N Narragansett Ave
- 1832 N Narragansett Ave
- 1844 N Narragansett Ave
- 1830 N Narragansett Ave
- 1819 N Nagle Ave
- 1848 N Narragansett Ave