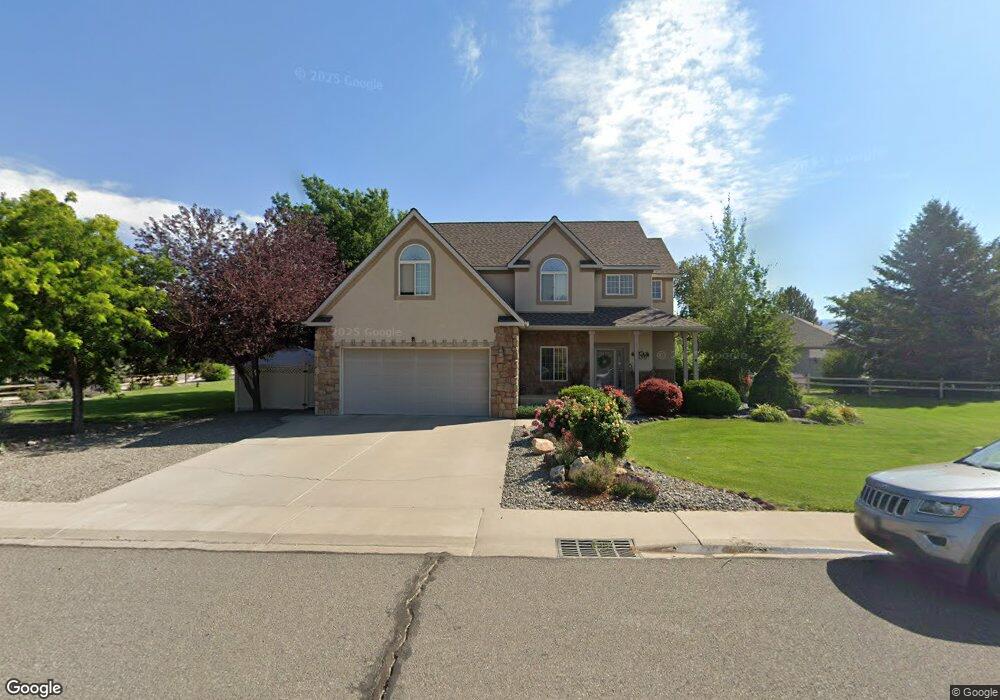
1839 Otter Pond Cir Montrose, CO 81401
Estimated Value: $649,865 - $696,000
4
Beds
3
Baths
2,414
Sq Ft
$278/Sq Ft
Est. Value
About This Home
This home is located at 1839 Otter Pond Cir, Montrose, CO 81401 and is currently estimated at $672,216, approximately $278 per square foot. 1839 Otter Pond Cir is a home located in Montrose County with nearby schools including Cottonwood Elementary School, Columbine Middle School, and Montrose High School.
Ownership History
Date
Name
Owned For
Owner Type
Purchase Details
Closed on
Apr 11, 2024
Sold by
Heavers Timothy E and Heavers Kathy L
Bought by
Mulkey Taylor and Mulkey Sierra
Current Estimated Value
Home Financials for this Owner
Home Financials are based on the most recent Mortgage that was taken out on this home.
Original Mortgage
$574,200
Outstanding Balance
$565,718
Interest Rate
6.94%
Mortgage Type
New Conventional
Estimated Equity
$106,498
Purchase Details
Closed on
Oct 31, 2002
Sold by
Jewkes Darren and Jewkes Laura
Bought by
Heavers Timothy E and Heavers Kathy L
Purchase Details
Closed on
Feb 15, 2000
Sold by
Otter Pond Lllp
Bought by
Jewkes Darren and Jewkes Laura
Purchase Details
Closed on
Jan 20, 2000
Sold by
Krabbe Harold E and Krabbe Margaret R
Bought by
Otter Pond Lllp
Purchase Details
Closed on
Nov 18, 1998
Sold by
Otter Pond Lllp
Bought by
Krabbe Harold E and Krabbe Margaret R
Purchase Details
Closed on
Jul 29, 1997
Sold by
Otter Pond Llc
Bought by
Otter Pond Lllp
Create a Home Valuation Report for This Property
The Home Valuation Report is an in-depth analysis detailing your home's value as well as a comparison with similar homes in the area
Home Values in the Area
Average Home Value in this Area
Purchase History
| Date | Buyer | Sale Price | Title Company |
|---|---|---|---|
| Mulkey Taylor | $638,000 | Land Title | |
| Heavers Timothy E | $253,000 | -- | |
| Jewkes Darren | $30,000 | -- | |
| Otter Pond Lllp | -- | -- | |
| Krabbe Harold E | $37,500 | -- | |
| Otter Pond Lllp | -- | -- |
Source: Public Records
Mortgage History
| Date | Status | Borrower | Loan Amount |
|---|---|---|---|
| Open | Mulkey Taylor | $574,200 |
Source: Public Records
Tax History Compared to Growth
Tax History
| Year | Tax Paid | Tax Assessment Tax Assessment Total Assessment is a certain percentage of the fair market value that is determined by local assessors to be the total taxable value of land and additions on the property. | Land | Improvement |
|---|---|---|---|---|
| 2024 | $1,982 | $34,540 | $5,930 | $28,610 |
| 2023 | $1,982 | $39,660 | $6,810 | $32,850 |
| 2022 | $1,400 | $27,300 | $4,520 | $22,780 |
| 2021 | $1,444 | $28,090 | $4,650 | $23,440 |
| 2020 | $1,021 | $22,360 | $4,030 | $18,330 |
| 2019 | $1,027 | $22,360 | $4,030 | $18,330 |
| 2018 | $1,009 | $21,770 | $3,380 | $18,390 |
| 2017 | $1,000 | $21,770 | $3,380 | $18,390 |
| 2016 | $954 | $22,090 | $3,410 | $18,680 |
| 2015 | $1,465 | $22,090 | $3,410 | $18,680 |
| 2014 | $1,268 | $20,450 | $3,410 | $17,040 |
Source: Public Records
Map
Nearby Homes
- TBD Otter Pond Cir
- TBD Woodgate Rd
- 1728 Keller Ct
- 1712 Keller Ct
- 16885 Wildwood Dr
- TBD Lot 1 Woodgate Rd
- TBD Lot 3 Woodgate Rd
- TBD Lot 2-2 Woodgate Rd
- TBD Lot 2 Woodgate Rd
- TBD Lot 2-3 Woodgate Rd
- TBD Lot 2-1 Woodgate Rd
- 66356 Otter Rd
- 4117 Waterfall Dr
- 66182 Crestview Dr
- TBD Oxbow Dr
- TBD S Hwy 550 & Otter Rd
- Lot 14 Teton Ct
- 3038 Glacier Dr
- 66711 Otter Rd
- Lot: 1 Highway 550
- 2035 Otter Pond Cir
- 1837 Otter Pond Cir
- 1841 Otter Pond Cir
- 2031 Otter Pond Cir
- 1844 Otter Pond Cir
- 1835 Otter Pond Cir
- 1840 Otter Pond Cir
- 2036 Otter Pond Cir
- 2034 Otter Pond Cir
- 2038 Otter Pond Cir
- 2029 Otter Pond Cir
- 1836 Otter Pond Cir
- 1848 Otter Pond Cir
- 1833 Otter Pond Cir
- 2040 Otter Pond Cir
- 2030 Otter Pond Cir
- 1831 Otter Pond Cir
- 2027 Otter Pond Cir
- 1852 Otter Pond Cir
- 1829 Otter Pond Cir