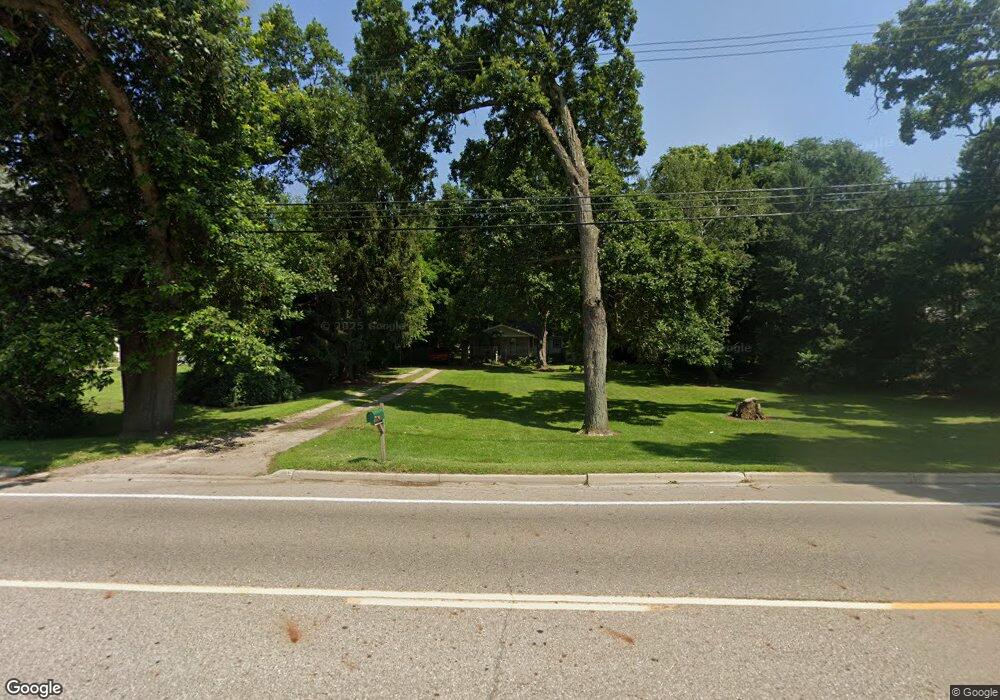
1839 Willoughby Rd Holt, MI 48842
Southern Lansing NeighborhoodEstimated Value: $124,330 - $151,000
--
Bed
--
Bath
664
Sq Ft
$211/Sq Ft
Est. Value
About This Home
This home is located at 1839 Willoughby Rd, Holt, MI 48842 and is currently estimated at $139,833, approximately $210 per square foot. 1839 Willoughby Rd is a home located in Ingham County with nearby schools including Elliott Elementary School, Hope Middle School, and Holt Junior High School.
Ownership History
Date
Name
Owned For
Owner Type
Purchase Details
Closed on
Dec 4, 2007
Sold by
Boegner Lisette and Boegner Lisette M
Bought by
Boegner Kurt J
Current Estimated Value
Purchase Details
Closed on
Apr 27, 2006
Sold by
Cogswell Arthur F and Cogswell Deborah
Bought by
Boegner Kurt J and Boegner Lisette M
Purchase Details
Closed on
Jan 16, 2002
Sold by
Cogswell Deborah L
Bought by
Cogswell Arthur F
Home Financials for this Owner
Home Financials are based on the most recent Mortgage that was taken out on this home.
Original Mortgage
$74,575
Interest Rate
7.24%
Mortgage Type
Purchase Money Mortgage
Purchase Details
Closed on
Jan 28, 2000
Sold by
Bawcum Mark T
Bought by
Cogswell Arthur F
Home Financials for this Owner
Home Financials are based on the most recent Mortgage that was taken out on this home.
Original Mortgage
$76,100
Interest Rate
7.98%
Mortgage Type
Purchase Money Mortgage
Create a Home Valuation Report for This Property
The Home Valuation Report is an in-depth analysis detailing your home's value as well as a comparison with similar homes in the area
Home Values in the Area
Average Home Value in this Area
Purchase History
| Date | Buyer | Sale Price | Title Company |
|---|---|---|---|
| Boegner Kurt J | -- | Michigan Bankers Title | |
| Boegner Kurt J | $100,000 | Talon Group | |
| Cogswell Arthur F | -- | First American Title Ins Co | |
| Cogswell Arthur F | $78,500 | Midstate Title Company | |
| Bawcum Mark T | -- | Midstate Title Company |
Source: Public Records
Mortgage History
| Date | Status | Borrower | Loan Amount |
|---|---|---|---|
| Previous Owner | Cogswell Arthur F | $74,575 | |
| Previous Owner | Cogswell Arthur F | $76,100 |
Source: Public Records
Tax History Compared to Growth
Tax History
| Year | Tax Paid | Tax Assessment Tax Assessment Total Assessment is a certain percentage of the fair market value that is determined by local assessors to be the total taxable value of land and additions on the property. | Land | Improvement |
|---|---|---|---|---|
| 2025 | $3,405 | $67,200 | $26,800 | $40,400 |
| 2024 | $16 | $63,700 | $26,800 | $36,900 |
| 2023 | $3,205 | $59,900 | $26,800 | $33,100 |
| 2022 | $2,930 | $49,100 | $23,100 | $26,000 |
| 2021 | $2,880 | $43,200 | $12,500 | $30,700 |
| 2020 | $2,880 | $38,500 | $12,500 | $26,000 |
| 2019 | $2,750 | $35,300 | $12,500 | $22,800 |
| 2018 | $2,730 | $32,700 | $12,500 | $20,200 |
| 2017 | $2,629 | $32,700 | $12,500 | $20,200 |
| 2016 | $2,665 | $32,300 | $12,500 | $19,800 |
| 2015 | $2,665 | $31,400 | $25,082 | $6,318 |
| 2014 | $2,665 | $32,600 | $32,124 | $476 |
Source: Public Records
Map
Nearby Homes
- 7011 Aurelius Rd
- 7061 W Bickett Blvd
- 6815 Aurelius Rd
- 4485 Helmsway Dr
- 4502 Bowline Ct
- 1925 Bowker Dr
- 2670 Brigantine Dr
- 4348 Norway St
- 2702 Yachtsman Dr
- 4335 Norway St
- 4345 Keelson Dr
- 4662 Tolland Ave
- 2564 Winterberry St Unit 12
- 4641 Tolland Ave
- 2545 Limerick Cir Unit 8
- 1265 Roth Dr
- 1700 Lockbridge Dr
- 2201 Bertha St
- 921 E Willoughby Rd
- 4327 Keller Rd
- 1901 Willoughby Rd
- 1823 Willoughby Rd
- 1811 Willoughby Rd
- 1921 Willoughby Rd
- 4559 Willoughby Rd
- 1801 Willoughby Rd
- 4553 Willoughby Rd
- 7027 Kingdon Ave
- 7021 Kingdon Ave
- 4543 E Willoughby Rd
- 1929 Willoughby Rd
- 4543 Willoughby Rd
- 4585 Willoughby Rd
- 4523 Willoughby Rd
- 1737 Willoughby Rd
- 7015 Kingdon Ave
- 1737 E Willoughby Rd
- 1937 Willoughby Rd
- 1906 Mulholland Dr
- 7001 Kingdon Ave