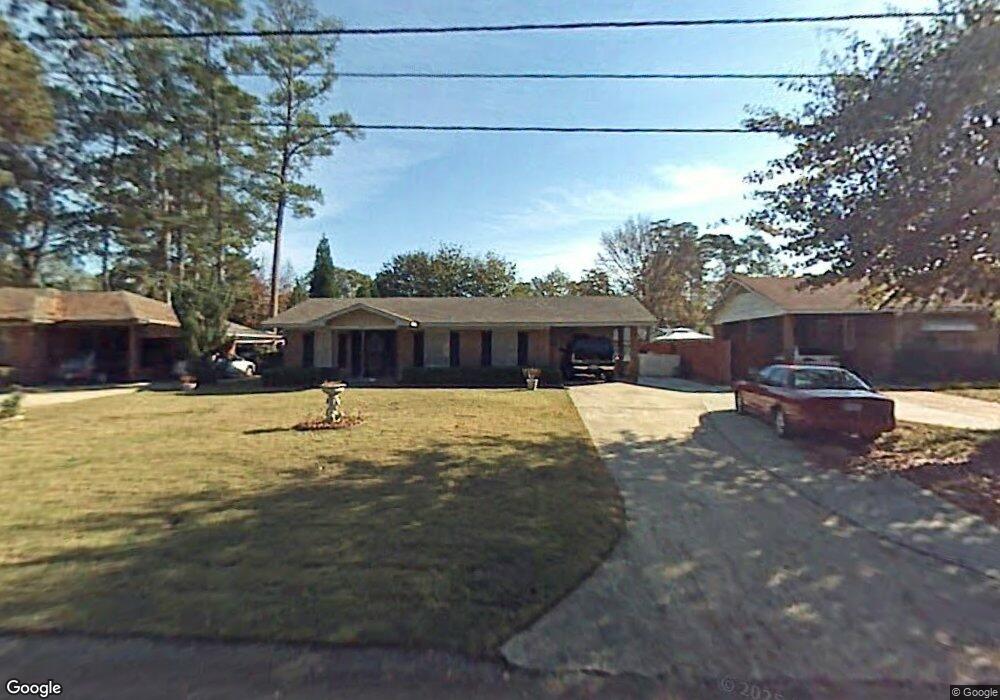
184 Bob o Link Dr Columbus, GA 31906
Eastern Columbus NeighborhoodEstimated Value: $129,000 - $173,425
2
Beds
2
Baths
1,404
Sq Ft
$112/Sq Ft
Est. Value
About This Home
This home is located at 184 Bob o Link Dr, Columbus, GA 31906 and is currently estimated at $157,106, approximately $111 per square foot. 184 Bob o Link Dr is a home located in Muscogee County with nearby schools including St. Mary's Road Magnet Academy, Baker Middle School, and Spencer High School.
Ownership History
Date
Name
Owned For
Owner Type
Purchase Details
Closed on
Aug 9, 2024
Sold by
Family Snowball Llc
Bought by
Handy James Thomas
Current Estimated Value
Home Financials for this Owner
Home Financials are based on the most recent Mortgage that was taken out on this home.
Original Mortgage
$126,750
Outstanding Balance
$125,338
Interest Rate
6.95%
Mortgage Type
New Conventional
Estimated Equity
$31,768
Purchase Details
Closed on
Apr 23, 2024
Sold by
Rcf 2 Acquisition Trust and Us Bank Trust Na
Bought by
Family Snowball Llc
Purchase Details
Closed on
Sep 5, 2023
Sold by
Rcf 2 Acquisition Trust
Bought by
Rcf 2 Acquisition Trust and Jones
Create a Home Valuation Report for This Property
The Home Valuation Report is an in-depth analysis detailing your home's value as well as a comparison with similar homes in the area
Home Values in the Area
Average Home Value in this Area
Purchase History
| Date | Buyer | Sale Price | Title Company |
|---|---|---|---|
| Handy James Thomas | $169,000 | None Listed On Document | |
| Family Snowball Llc | $68,250 | None Listed On Document | |
| Rcf 2 Acquisition Trust | $73,500 | None Listed On Document |
Source: Public Records
Mortgage History
| Date | Status | Borrower | Loan Amount |
|---|---|---|---|
| Open | Handy James Thomas | $126,750 |
Source: Public Records
Tax History Compared to Growth
Tax History
| Year | Tax Paid | Tax Assessment Tax Assessment Total Assessment is a certain percentage of the fair market value that is determined by local assessors to be the total taxable value of land and additions on the property. | Land | Improvement |
|---|---|---|---|---|
| 2025 | $2,593 | $66,240 | $6,320 | $59,920 |
| 2024 | $1,529 | $39,052 | $6,320 | $32,732 |
| 2023 | $25 | $39,052 | $6,320 | $32,732 |
| 2022 | $694 | $32,848 | $6,320 | $26,528 |
| 2021 | $687 | $33,076 | $6,320 | $26,756 |
| 2020 | $687 | $33,076 | $6,320 | $26,756 |
| 2019 | $691 | $33,076 | $6,320 | $26,756 |
| 2018 | $691 | $33,076 | $6,320 | $26,756 |
| 2017 | $695 | $33,076 | $6,320 | $26,756 |
| 2016 | $699 | $30,216 | $3,000 | $27,216 |
| 2015 | $700 | $30,216 | $3,000 | $27,216 |
| 2014 | $702 | $30,216 | $3,000 | $27,216 |
| 2013 | -- | $30,216 | $3,000 | $27,216 |
Source: Public Records
Map
Nearby Homes
- 130 Sycamore Ct
- 229 N Oakley Dr
- 3589 Irwin Way
- 409 Florida Dr
- 3943 Curry St
- 3402 Montecello Dr
- 3400 Saint Marys Rd Unit 450
- 4422 Pate Dr
- 4437 St Marys Rd
- 4534 Sentry St
- 679 Parkchester Dr
- 716 Benning Dr
- 410 McCartha Dr
- 4516 Sims St
- 917 Fletcher Ave
- 4408 Ridgefield Dr
- 3711 Youmans St
- 810 Winston Rd
- 824 Winston Rd
- 906 Winston Rd
- 184 Bob-O-link Dr
- 178 Bob o Link Dr
- 204 Bob o Link Dr
- 183 Playa Delray Dr
- 172 Bob o Link Dr
- 210 Bob o Link Dr
- 177 Playa Delray Dr
- 205 Playa Delray Dr
- 183 Bob o Link Dr
- 201 Bob o Link Dr
- 171 Playa Delray Dr
- 175 Bob o Link Dr
- 209 Bob-O-link Dr
- 166 Bob o Link Dr
- 211 Playa Delray Dr
- 216 Bob o Link Dr
- 209 Bob o Link Dr
- 169 Bob o Link Dr
- 165 Playa Delray Dr
- 217 Playa Delray Dr