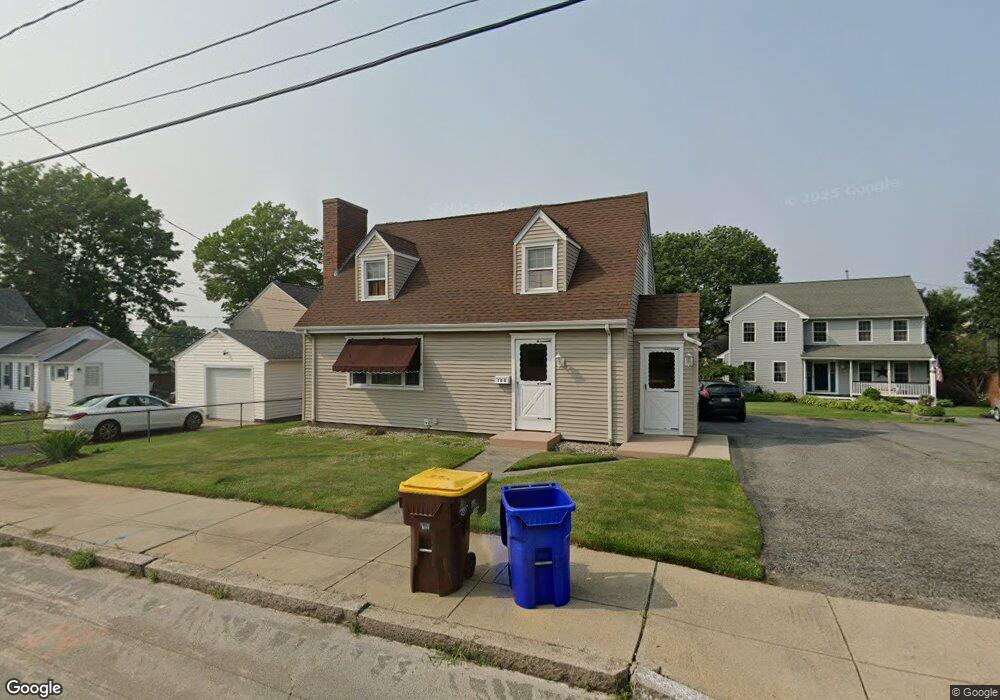
184 Globe St Fall River, MA 02724
Sandy Beach NeighborhoodEstimated Value: $355,000 - $428,000
2
Beds
2
Baths
1,075
Sq Ft
$356/Sq Ft
Est. Value
About This Home
This home is located at 184 Globe St, Fall River, MA 02724 and is currently estimated at $382,740, approximately $356 per square foot. 184 Globe St is a home located in Bristol County with nearby schools including Carlton M. Viveiros Elementary School, Matthew J. Kuss Middle School, and B M C Durfee High School.
Ownership History
Date
Name
Owned For
Owner Type
Purchase Details
Closed on
Jul 11, 2025
Sold by
Boule Sandra A Est and Boule
Bought by
Raymond and Boule Supplemen
Current Estimated Value
Purchase Details
Closed on
Nov 3, 2021
Sold by
Boule Raymond and Boule Sandra A
Bought by
Boule Sandra A
Purchase Details
Closed on
Mar 26, 1973
Bought by
Boule Raymond and Boule Sandra A
Create a Home Valuation Report for This Property
The Home Valuation Report is an in-depth analysis detailing your home's value as well as a comparison with similar homes in the area
Home Values in the Area
Average Home Value in this Area
Purchase History
| Date | Buyer | Sale Price | Title Company |
|---|---|---|---|
| Raymond | -- | -- | |
| Raymond | -- | -- | |
| Boule Sandra A | -- | None Available | |
| Boule Sandra A | -- | None Available | |
| Boule Raymond | -- | -- |
Source: Public Records
Mortgage History
| Date | Status | Borrower | Loan Amount |
|---|---|---|---|
| Previous Owner | Boule Raymond | $55,000 | |
| Previous Owner | Boule Raymond | $30,000 |
Source: Public Records
Tax History
| Year | Tax Paid | Tax Assessment Tax Assessment Total Assessment is a certain percentage of the fair market value that is determined by local assessors to be the total taxable value of land and additions on the property. | Land | Improvement |
|---|---|---|---|---|
| 2025 | $3,532 | $308,500 | $107,300 | $201,200 |
| 2024 | $3,332 | $290,000 | $103,400 | $186,600 |
| 2023 | $3,225 | $262,800 | $85,400 | $177,400 |
| 2022 | $2,894 | $229,300 | $81,300 | $148,000 |
| 2021 | $2,770 | $200,300 | $77,400 | $122,900 |
| 2020 | $2,626 | $181,700 | $76,300 | $105,400 |
| 2019 | $2,550 | $174,900 | $73,400 | $101,500 |
| 2018 | $2,547 | $174,200 | $79,500 | $94,700 |
| 2017 | $2,363 | $168,800 | $75,800 | $93,000 |
| 2016 | $2,302 | $168,900 | $80,700 | $88,200 |
| 2015 | $2,150 | $164,400 | $80,700 | $83,700 |
| 2014 | $2,038 | $162,000 | $78,300 | $83,700 |
Source: Public Records
Map
Nearby Homes
- 20 Wilcox St
- 464 Birch St
- 1334 S Main St
- 1273-1279 S Main St
- 245 Dwelly St
- 609 King Philip St
- 70 Brown St
- 1846 S Main St
- 234 Kilburn St
- 1852 S Main St
- 917 Dwelly St
- 344-354 E Main St
- 71 Mystic St Unit 3
- 219 Montaup St
- 57 Larouche St
- 15 Higgins St
- 82 Montaup St
- 240 Montaup St
- 420 Bradford Ave
- 700 Shore Dr Unit 6-604
Your Personal Tour Guide
Ask me questions while you tour the home.