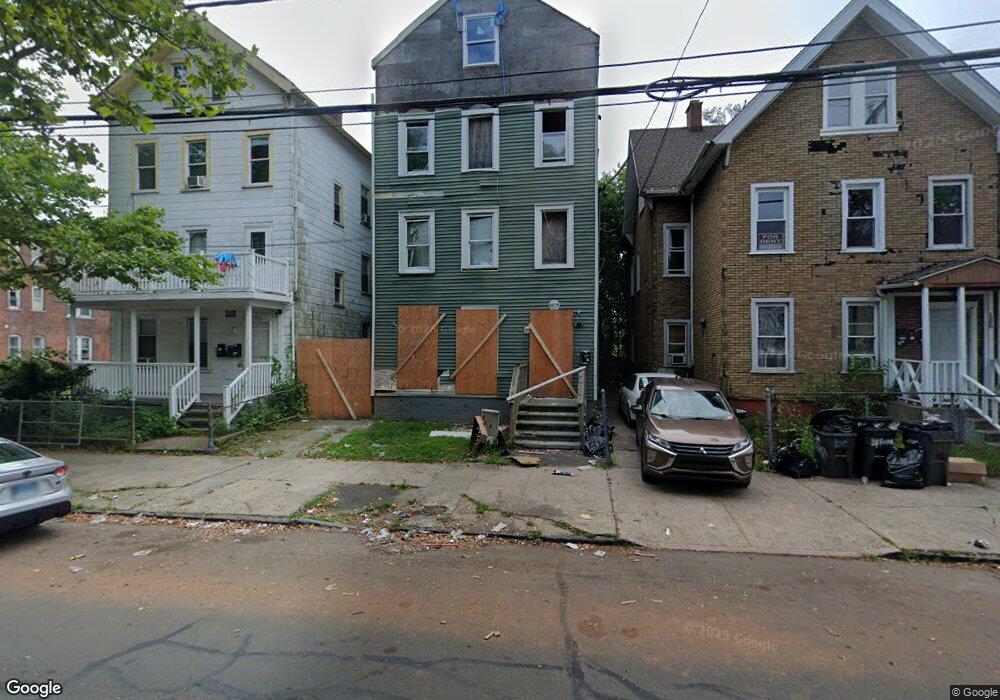
184 James St New Haven, CT 06513
Fair Haven NeighborhoodEstimated Value: $380,192 - $562,000
9
Beds
3
Baths
4,004
Sq Ft
$115/Sq Ft
Est. Value
About This Home
This home is located at 184 James St, New Haven, CT 06513 and is currently estimated at $462,048, approximately $115 per square foot. 184 James St is a home located in New Haven County with nearby schools including Elm City College Preparatory School, Cold Spring School, and St Francis & St Rose Of Lima School.
Ownership History
Date
Name
Owned For
Owner Type
Purchase Details
Closed on
Jan 23, 2020
Sold by
Y G Capital Llc
Bought by
Bbym De2 Llc
Current Estimated Value
Home Financials for this Owner
Home Financials are based on the most recent Mortgage that was taken out on this home.
Original Mortgage
$3,800,000
Outstanding Balance
$1,821,832
Interest Rate
3.74%
Mortgage Type
New Conventional
Estimated Equity
-$1,359,784
Purchase Details
Closed on
Jan 4, 2017
Sold by
Reichman Brodie Real E
Bought by
Yg Capital Llc
Purchase Details
Closed on
Sep 29, 2016
Sold by
Redevelopers New Haven
Bought by
Reichman Brodie Real E
Purchase Details
Closed on
Jul 27, 2010
Sold by
Wades Housing Llc
Bought by
Nhvn Redevelopers Llc
Purchase Details
Closed on
Dec 2, 2009
Sold by
Beecher Wade
Bought by
Wades Housing Llc
Purchase Details
Closed on
May 11, 1995
Sold by
849 Lincoln Ave Corp
Bought by
Farrow Theodore J
Purchase Details
Closed on
Mar 22, 1995
Sold by
Ge Capital Asset Mgmt
Bought by
Chemical Bk
Purchase Details
Closed on
Jan 12, 1994
Sold by
Chemical Bk
Bought by
Ge Capital Asset Mgmnt
Purchase Details
Closed on
Dec 21, 1989
Sold by
Rodriguez Hector
Bought by
Manning Barbara D
Create a Home Valuation Report for This Property
The Home Valuation Report is an in-depth analysis detailing your home's value as well as a comparison with similar homes in the area
Home Values in the Area
Average Home Value in this Area
Purchase History
| Date | Buyer | Sale Price | Title Company |
|---|---|---|---|
| Bbym De2 Llc | -- | None Available | |
| Yg Capital Llc | -- | -- | |
| Reichman Brodie Real E | $200,000 | -- | |
| Nhvn Redevelopers Llc | $155,600 | -- | |
| Wades Housing Llc | -- | -- | |
| Beecher Wade | $75,500 | -- | |
| Farrow Theodore J | $7,500 | -- | |
| Chemical Bk | $79,505 | -- | |
| Ge Capital Asset Mgmnt | $78,343 | -- | |
| Manning Barbara D | $175,000 | -- |
Source: Public Records
Mortgage History
| Date | Status | Borrower | Loan Amount |
|---|---|---|---|
| Open | Bbym De2 Llc | $3,800,000 | |
| Previous Owner | Manning Barbara D | $2,300,000 | |
| Previous Owner | Manning Barbara D | $2,482,900 |
Source: Public Records
Tax History Compared to Growth
Tax History
| Year | Tax Paid | Tax Assessment Tax Assessment Total Assessment is a certain percentage of the fair market value that is determined by local assessors to be the total taxable value of land and additions on the property. | Land | Improvement |
|---|---|---|---|---|
| 2025 | $9,866 | $250,402 | $38,150 | $212,252 |
| 2024 | $9,640 | $250,402 | $38,150 | $212,252 |
| 2023 | $9,315 | $250,402 | $38,150 | $212,252 |
| 2022 | $10,348 | $260,330 | $38,150 | $222,180 |
| 2021 | $6,724 | $153,230 | $30,520 | $122,710 |
| 2020 | $6,724 | $153,230 | $30,520 | $122,710 |
| 2019 | $6,586 | $153,230 | $30,520 | $122,710 |
| 2018 | $6,586 | $153,230 | $30,520 | $122,710 |
| 2017 | $5,927 | $153,230 | $30,520 | $122,710 |
| 2016 | $4,665 | $112,280 | $13,860 | $98,420 |
| 2015 | $4,665 | $112,280 | $13,860 | $98,420 |
| 2014 | $4,665 | $112,280 | $13,860 | $98,420 |
Source: Public Records
Map
Nearby Homes
- 181 James St
- 56 Woolsey St
- 83 James St
- 213 Saltonstall Ave
- 187 Saltonstall Ave
- 254 James St
- 36 Shelter St
- 295 Lloyd St
- 114 Blatchley Ave
- 115 Clay St
- 74 Fillmore St
- 308 Poplar St
- 354 Blatchley Ave
- 35 Saltonstall Ave
- 111 Chapel St
- 30 Monroe St
- 15 Alton St
- 121 Fillmore St
- 373 Blatchley Ave
- 85 Pierpont St