Estimated Value: $512,000 - $601,744
3
Beds
2
Baths
3,600
Sq Ft
$155/Sq Ft
Est. Value
About This Home
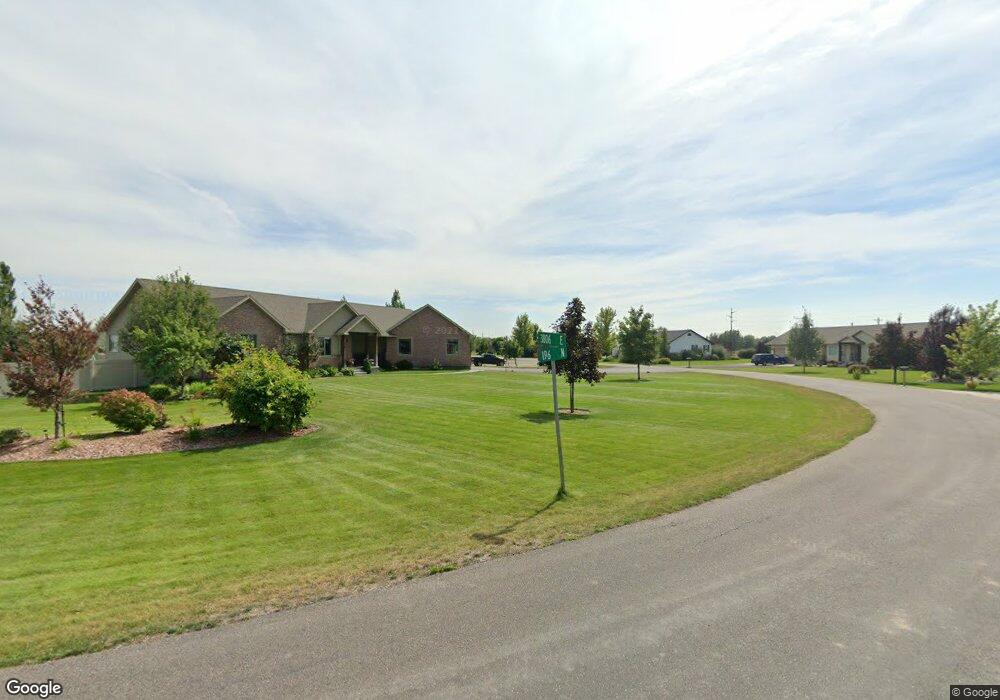
This home is located at 184 N 3806 E, Rigby, ID 83442 and is currently estimated at $557,436, approximately $154 per square foot. 184 N 3806 E is a home located in Jefferson County with nearby schools including Jefferson Elementary School, Rigby Middle School, and Rigby High School.
Ownership History
Date
Name
Owned For
Owner Type
Purchase Details
Closed on
Jul 11, 2024
Sold by
Richardson Kerry and Richardson Kaylee
Bought by
Richardson Kerry
Current Estimated Value
Purchase Details
Closed on
Nov 16, 2009
Sold by
Home Equity Asset Trust
Bought by
Richardson Kerry and Richardson Heather
Home Financials for this Owner
Home Financials are based on the most recent Mortgage that was taken out on this home.
Original Mortgage
$195,360
Interest Rate
4.88%
Mortgage Type
FHA
Purchase Details
Closed on
Nov 29, 2006
Sold by
Hendricks Dave and Hendricks Tammy
Bought by
Henderson Paul and Henderson Katia
Home Financials for this Owner
Home Financials are based on the most recent Mortgage that was taken out on this home.
Original Mortgage
$203,920
Interest Rate
8.89%
Mortgage Type
Adjustable Rate Mortgage/ARM
Purchase Details
Closed on
Apr 20, 2006
Sold by
Grand West Development Llc
Bought by
Hendricks Dave and Hendricks Tammy
Create a Home Valuation Report for This Property
The Home Valuation Report is an in-depth analysis detailing your home's value as well as a comparison with similar homes in the area
Home Values in the Area
Average Home Value in this Area
Purchase History
We collect this data history from publicly available records. To have your information removed, we recommend requesting removal directly through your county’s website.
| Date | Buyer | Sale Price | Title Company |
|---|---|---|---|
| Richardson Kerry | -- | None Listed On Document | |
| Richardson Kerry | -- | Alliance Title & Escrow | |
| Richardson Kerry | -- | -- | |
| Henderson Paul | -- | -- | |
| Hendricks Dave | -- | -- |
Source: Public Records
Mortgage History
We collect this data history from publicly available records. To have your information removed, we recommend requesting removal directly through your county’s website.
| Date | Status | Borrower | Loan Amount |
|---|---|---|---|
| Previous Owner | Richardson Kerry | $195,360 | |
| Previous Owner | Henderson Paul | $203,920 |
Source: Public Records
Tax History
| Year | Tax Paid | Tax Assessment Tax Assessment Total Assessment is a certain percentage of the fair market value that is determined by local assessors to be the total taxable value of land and additions on the property. | Land | Improvement |
|---|---|---|---|---|
| 2025 | $1,165 | $549,618 | $0 | $0 |
| 2024 | $1,165 | $546,560 | $0 | $0 |
| 2023 | $1,820 | $572,746 | $0 | $0 |
| 2022 | $2,695 | $507,584 | $0 | $0 |
| 2021 | $2,380 | $378,099 | $0 | $0 |
| 2020 | $1,887 | $341,804 | $0 | $0 |
| 2019 | $2,059 | $301,151 | $0 | $0 |
| 2018 | $1,795 | $264,549 | $0 | $0 |
| 2017 | $1,656 | $245,797 | $0 | $0 |
| 2016 | $1,531 | $132,025 | $0 | $0 |
| 2015 | $1,444 | $119,474 | $0 | $0 |
| 2014 | $1,512 | $125,134 | $0 | $0 |
| 2013 | -- | $125,310 | $0 | $0 |
Source: Public Records
Map
Nearby Homes
Your Personal Tour Guide
Ask me questions while you tour the home.