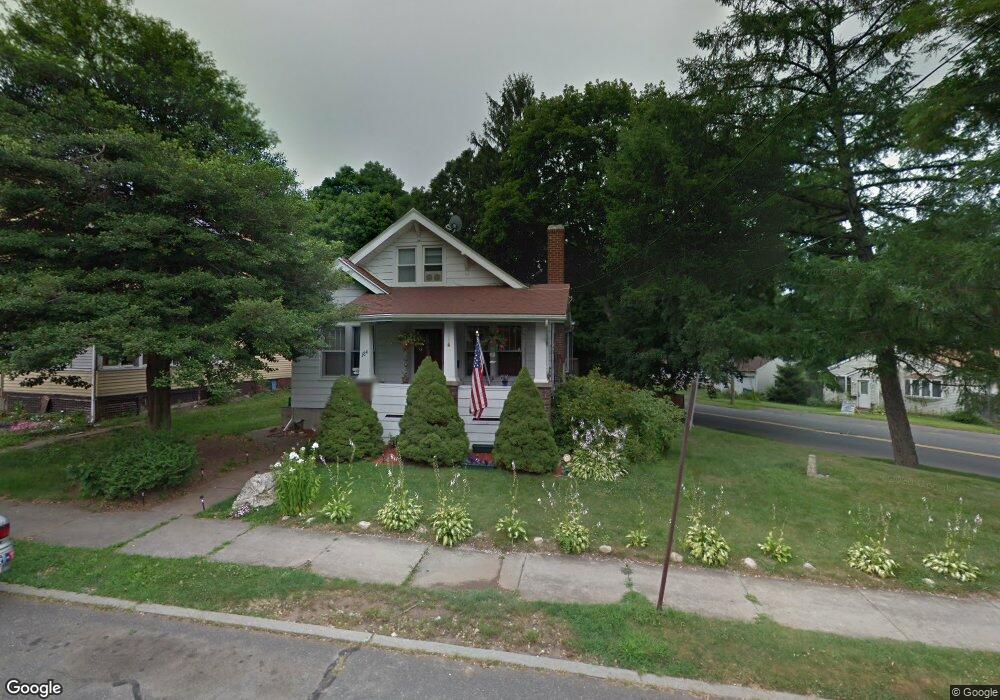
184 Newton St Meriden, CT 06450
Estimated Value: $275,835 - $290,000
3
Beds
2
Baths
1,219
Sq Ft
$234/Sq Ft
Est. Value
About This Home
This home is located at 184 Newton St, Meriden, CT 06450 and is currently estimated at $284,709, approximately $233 per square foot. 184 Newton St is a home located in New Haven County with nearby schools including Roger Sherman Elementary School, Washington Middle School, and Francis T. Maloney High School.
Ownership History
Date
Name
Owned For
Owner Type
Purchase Details
Closed on
Mar 27, 1998
Sold by
Cashman James F and Cashman Irene L
Bought by
Sokolowski Thomas J and Sokolowski Deborah A
Current Estimated Value
Home Financials for this Owner
Home Financials are based on the most recent Mortgage that was taken out on this home.
Original Mortgage
$83,400
Outstanding Balance
$15,176
Interest Rate
6.96%
Mortgage Type
Unknown
Estimated Equity
$269,533
Create a Home Valuation Report for This Property
The Home Valuation Report is an in-depth analysis detailing your home's value as well as a comparison with similar homes in the area
Home Values in the Area
Average Home Value in this Area
Purchase History
| Date | Buyer | Sale Price | Title Company |
|---|---|---|---|
| Sokolowski Thomas J | $85,000 | -- |
Source: Public Records
Mortgage History
| Date | Status | Borrower | Loan Amount |
|---|---|---|---|
| Open | Sokolowski Thomas J | $83,400 | |
| Closed | Sokolowski Thomas J | $3,000 |
Source: Public Records
Tax History Compared to Growth
Tax History
| Year | Tax Paid | Tax Assessment Tax Assessment Total Assessment is a certain percentage of the fair market value that is determined by local assessors to be the total taxable value of land and additions on the property. | Land | Improvement |
|---|---|---|---|---|
| 2025 | $4,389 | $115,780 | $51,380 | $64,400 |
| 2024 | $4,459 | $115,780 | $51,380 | $64,400 |
| 2023 | $4,298 | $115,780 | $51,380 | $64,400 |
| 2022 | $4,055 | $115,780 | $51,380 | $64,400 |
| 2021 | $4,443 | $102,060 | $50,960 | $51,100 |
| 2020 | $4,430 | $102,060 | $50,960 | $51,100 |
| 2019 | $4,155 | $96,530 | $50,960 | $45,570 |
| 2018 | $4,171 | $96,530 | $50,960 | $45,570 |
| 2017 | $4,060 | $96,530 | $50,960 | $45,570 |
| 2016 | $3,604 | $92,540 | $44,800 | $47,740 |
| 2015 | $3,604 | $92,960 | $45,220 | $47,740 |
| 2014 | $3,517 | $92,960 | $45,220 | $47,740 |
Source: Public Records
Map
Nearby Homes
- 252-254 & 260 Liberty St
- 760 Broad St
- 112 Hobart St
- 156 Hobart St
- 28 Orient St
- 172 Sterling Village Unit 172
- 47 Huber Ave
- 246 Pratt St
- 250 Pratt St
- 131 Converse Ave
- 145 Camp St
- 192 Converse Ave
- 122 Carpenter Ave
- 654 Liberty St Unit 3
- 80 Dryden Dr
- 255 Atkins Street Extension
- 56 Gravel St
- 178 Elm St
- 69 Putnam St
- 80 Olive St