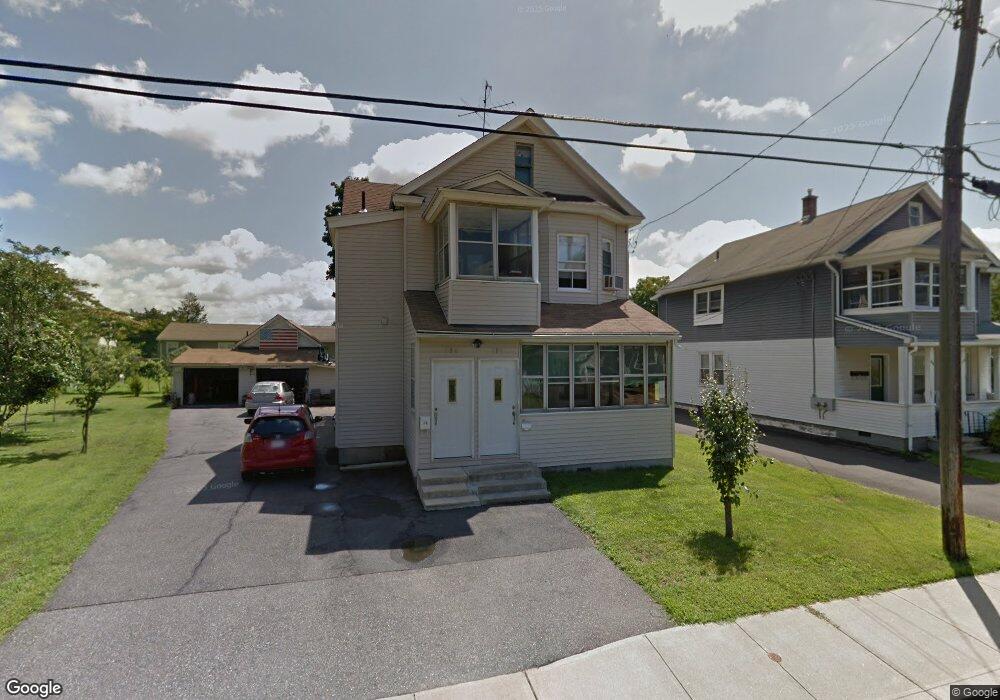
184 Prospect St Ludlow, MA 01056
Estimated Value: $304,000 - $329,000
2
Beds
2
Baths
1,342
Sq Ft
$235/Sq Ft
Est. Value
About This Home
This home is located at 184 Prospect St, Ludlow, MA 01056 and is currently estimated at $315,420, approximately $235 per square foot. 184 Prospect St is a home located in Hampden County with nearby schools including East Street Elementary School, Chapin Street Elementary School, and Paul R. Baird Middle School.
Ownership History
Date
Name
Owned For
Owner Type
Purchase Details
Closed on
Oct 16, 2018
Sold by
Ramos Fernando
Bought by
Ramos Daniel
Current Estimated Value
Home Financials for this Owner
Home Financials are based on the most recent Mortgage that was taken out on this home.
Original Mortgage
$144,000
Outstanding Balance
$124,536
Interest Rate
4.5%
Mortgage Type
New Conventional
Estimated Equity
$190,884
Purchase Details
Closed on
Dec 5, 2000
Sold by
Alberto Joseph Est and Alberto
Bought by
Ramos Joaquim J
Home Financials for this Owner
Home Financials are based on the most recent Mortgage that was taken out on this home.
Original Mortgage
$45,000
Interest Rate
7.76%
Mortgage Type
Purchase Money Mortgage
Create a Home Valuation Report for This Property
The Home Valuation Report is an in-depth analysis detailing your home's value as well as a comparison with similar homes in the area
Home Values in the Area
Average Home Value in this Area
Purchase History
| Date | Buyer | Sale Price | Title Company |
|---|---|---|---|
| Ramos Daniel | $180,000 | -- | |
| Ramos Daniel | $180,000 | -- | |
| Ramos Fernando | -- | -- | |
| Ramos Fernando | -- | -- | |
| Ramos Joaquim J | $65,000 | -- | |
| Ramos Joaquim J | $65,000 | -- |
Source: Public Records
Mortgage History
| Date | Status | Borrower | Loan Amount |
|---|---|---|---|
| Open | Ramos Daniel | $144,000 | |
| Closed | Ramos Daniel | $144,000 | |
| Previous Owner | Ramos Joaquim J | $45,000 |
Source: Public Records
Tax History
| Year | Tax Paid | Tax Assessment Tax Assessment Total Assessment is a certain percentage of the fair market value that is determined by local assessors to be the total taxable value of land and additions on the property. | Land | Improvement |
|---|---|---|---|---|
| 2025 | $3,951 | $227,700 | $74,000 | $153,700 |
| 2024 | $3,826 | $211,500 | $74,000 | $137,500 |
| 2023 | $3,574 | $183,200 | $64,900 | $118,300 |
| 2022 | $3,544 | $177,300 | $64,900 | $112,400 |
| 2021 | $3,685 | $174,800 | $64,900 | $109,900 |
| 2020 | $3,532 | $171,300 | $64,000 | $107,300 |
| 2019 | $3,304 | $166,700 | $63,300 | $103,400 |
| 2018 | $3,101 | $163,100 | $63,300 | $99,800 |
| 2017 | $2,987 | $161,200 | $61,500 | $99,700 |
| 2016 | $2,834 | $156,300 | $60,200 | $96,100 |
| 2015 | $2,661 | $153,900 | $59,600 | $94,300 |
Source: Public Records
Map
Nearby Homes
- 162 Highland Ave
- 259 Prospect St
- 31 Greenwich St
- 350 West Ave Unit 5
- 37 Franklin St
- 517 Ideal Ln Unit 401
- 39 Rogers Ave
- 98 Fuller St Unit 32
- 102 Swan Ave
- 0 Center St Unit 73415933
- 37 Waters Edge Unit 37
- 53 Waters Edge
- 84 Chapin Greene Dr
- 676 Chapin St
- 70 Sroka Ln
- 12 Weston St
- 107 Enfield St
- 24 Dumaine St
- 0 N S Main St Io
- 46-48 Milton St
- 0 Highland Place
- 198 Prospect St
- 55 Haviland St
- 178 Prospect St
- 63 Haviland St
- 47 Haviland St
- 204 Prospect St
- 179 Prospect St
- 183 Prospect St
- 175 Prospect St
- 67 Haviland St
- 168 Prospect St
- 171 Prospect St
- 37 Haviland St
- 210 Prospect St
- 71 Haviland St
- 194 Highland Ave
- 165 Prospect St
- 190 Highland Ave
- 7 Highland Place
Your Personal Tour Guide
Ask me questions while you tour the home.