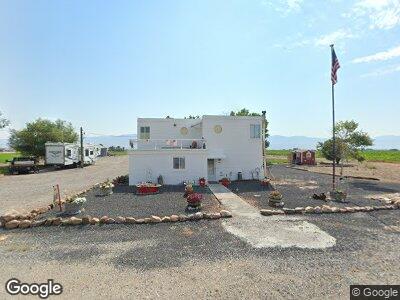
184 S 200 E Trenton, UT 84338
Estimated Value: $385,587 - $516,000
4
Beds
2
Baths
2,100
Sq Ft
$210/Sq Ft
Est. Value
About This Home
This home is located at 184 S 200 E, Trenton, UT 84338 and is currently estimated at $440,397, approximately $209 per square foot. 184 S 200 E is a home located in Cache County with nearby schools including Lewiston School, White Pine Middle School, and North Cache Middle School.
Ownership History
Date
Name
Owned For
Owner Type
Purchase Details
Closed on
May 19, 2006
Sold by
Hatch Kim
Bought by
Hatch Kim and Hatch Kirt
Current Estimated Value
Home Financials for this Owner
Home Financials are based on the most recent Mortgage that was taken out on this home.
Original Mortgage
$10,723
Interest Rate
6.52%
Mortgage Type
Unknown
Purchase Details
Closed on
Apr 28, 2006
Sold by
Hatch Marla Kim
Bought by
Hatch Byron Kirt and Hatch Marla Kim
Home Financials for this Owner
Home Financials are based on the most recent Mortgage that was taken out on this home.
Original Mortgage
$10,723
Interest Rate
6.52%
Mortgage Type
Unknown
Purchase Details
Closed on
Mar 21, 2001
Sold by
Mcgovern Francis C and Mcgovern Sally J
Bought by
Nielson Kara
Home Financials for this Owner
Home Financials are based on the most recent Mortgage that was taken out on this home.
Original Mortgage
$112,990
Interest Rate
6.97%
Mortgage Type
FHA
Create a Home Valuation Report for This Property
The Home Valuation Report is an in-depth analysis detailing your home's value as well as a comparison with similar homes in the area
Home Values in the Area
Average Home Value in this Area
Purchase History
| Date | Buyer | Sale Price | Title Company |
|---|---|---|---|
| Hatch Kim | -- | Accommodation | |
| Hatch Byron Kirt | -- | Advanced Title | |
| Hatch Marla Kim | -- | Advanced Title | |
| Nielson Kara | -- | Northern Title Company |
Source: Public Records
Mortgage History
| Date | Status | Borrower | Loan Amount |
|---|---|---|---|
| Open | Hatch Byron Kirt | $75,000 | |
| Open | Hatch Byron Kirt | $157,000 | |
| Closed | Hatch Byron Kirt | $30,000 | |
| Closed | Hatch Kim | $10,723 | |
| Closed | Hatch Marla Kim | $144,000 | |
| Closed | Hatch Kim | $17,328 | |
| Closed | Nielson Kara | $112,990 |
Source: Public Records
Tax History Compared to Growth
Tax History
| Year | Tax Paid | Tax Assessment Tax Assessment Total Assessment is a certain percentage of the fair market value that is determined by local assessors to be the total taxable value of land and additions on the property. | Land | Improvement |
|---|---|---|---|---|
| 2024 | $1,545 | $218,525 | $0 | $0 |
| 2023 | $1,642 | $217,980 | $0 | $0 |
| 2022 | $1,328 | $168,780 | $0 | $0 |
| 2021 | $1,264 | $235,552 | $82,660 | $152,892 |
| 2020 | $1,157 | $201,516 | $82,660 | $118,856 |
| 2019 | $1,044 | $171,051 | $52,195 | $118,856 |
| 2018 | $1,003 | $158,895 | $52,195 | $106,700 |
| 2017 | $984 | $87,460 | $0 | $0 |
| 2016 | $997 | $87,460 | $0 | $0 |
| 2015 | $996 | $87,460 | $0 | $0 |
| 2014 | $970 | $87,510 | $0 | $0 |
| 2013 | -- | $87,510 | $0 | $0 |
Source: Public Records
Map
Nearby Homes
- 10200 N 5800 W
- 365 E Main St Unit 2
- 6350 W 9000 N
- 1090 S 2400 W
- 1074 S 800 W
- 1120 S 800 W
- 159 N 200 E
- 165 W 200 N
- 116 W 200 N Unit 22
- 136 W 200 N Unit 21
- 222 W 200 N Unit 18
- 158 W 200 N Unit 20
- 244 W 200 N Unit 17
- 260 W 200 N Unit 16
- 312 W 200 N Unit 10
- 340 W 200 N Unit 9
- 362 W 200 N Unit 8
- 7405 N 2400 W
- 115 N 100 W Unit 23
- 342 N Main St