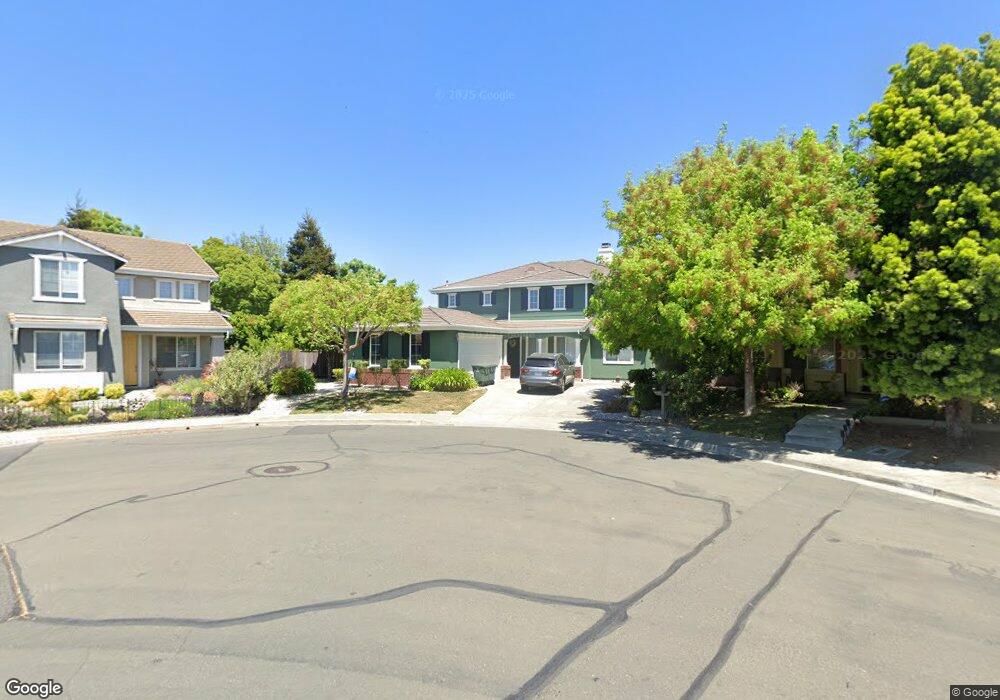
184 San Marco Way American Canyon, CA 94503
Estimated Value: $840,000 - $909,000
4
Beds
3
Baths
3,052
Sq Ft
$285/Sq Ft
Est. Value
About This Home
This home is located at 184 San Marco Way, American Canyon, CA 94503 and is currently estimated at $870,848, approximately $285 per square foot. 184 San Marco Way is a home located in Napa County with nearby schools including Donaldson Way Elementary School, American Canyon Middle School, and American Canyon High School.
Ownership History
Date
Name
Owned For
Owner Type
Purchase Details
Closed on
May 22, 2025
Sold by
Lee-Yeager Nancy
Bought by
Nancy Lee Living Trust and Lee
Current Estimated Value
Purchase Details
Closed on
Aug 18, 2022
Sold by
Yeager Russell E
Bought by
Lee-Yeager Nancy
Purchase Details
Closed on
Mar 29, 2018
Sold by
Yeager Nancy Lee and Yeager Russell E
Bought by
Lee Yeager Nancy and Yeager Russell E
Home Financials for this Owner
Home Financials are based on the most recent Mortgage that was taken out on this home.
Original Mortgage
$330,000
Interest Rate
4.4%
Mortgage Type
New Conventional
Purchase Details
Closed on
Dec 7, 2001
Sold by
Greystone Homes Inc
Bought by
Yeager Russell E and Yeager Nancy Lee
Home Financials for this Owner
Home Financials are based on the most recent Mortgage that was taken out on this home.
Original Mortgage
$342,050
Interest Rate
5.87%
Create a Home Valuation Report for This Property
The Home Valuation Report is an in-depth analysis detailing your home's value as well as a comparison with similar homes in the area
Home Values in the Area
Average Home Value in this Area
Purchase History
| Date | Buyer | Sale Price | Title Company |
|---|---|---|---|
| Nancy Lee Living Trust | -- | None Listed On Document | |
| Lee-Yeager Nancy | -- | -- | |
| Lee Yeager Nancy | -- | Nextitle | |
| Yeager Russell E | $428,000 | North American Title Co |
Source: Public Records
Mortgage History
| Date | Status | Borrower | Loan Amount |
|---|---|---|---|
| Previous Owner | Lee Yeager Nancy | $330,000 | |
| Previous Owner | Yeager Russell E | $342,050 |
Source: Public Records
Tax History Compared to Growth
Tax History
| Year | Tax Paid | Tax Assessment Tax Assessment Total Assessment is a certain percentage of the fair market value that is determined by local assessors to be the total taxable value of land and additions on the property. | Land | Improvement |
|---|---|---|---|---|
| 2025 | $6,854 | $631,654 | $147,721 | $483,933 |
| 2024 | $6,854 | $619,270 | $144,825 | $474,445 |
| 2023 | $6,854 | $607,129 | $141,986 | $465,143 |
| 2022 | $6,616 | $595,225 | $139,202 | $456,023 |
| 2021 | $6,512 | $583,555 | $136,473 | $447,082 |
| 2020 | $6,459 | $577,572 | $135,074 | $442,498 |
| 2019 | $6,337 | $566,248 | $132,426 | $433,822 |
| 2018 | $6,274 | $555,146 | $129,830 | $425,316 |
| 2017 | $6,171 | $544,262 | $127,285 | $416,977 |
| 2016 | $6,107 | $533,591 | $124,790 | $408,801 |
| 2015 | $5,753 | $525,577 | $122,916 | $402,661 |
| 2014 | $4,329 | $392,700 | $103,950 | $288,750 |
Source: Public Records
Map
Nearby Homes
- 240 Newbury Way
- 2117 Elliott Dr
- 177 Brophy St
- 259 Los Altos Place
- 706 Capra Dr
- 1634 Severus Dr
- 18 Joan Dr
- 240 W Carolyn Dr
- 0 Melvin Rd Unit 324032406
- 0 Melvin Rd Unit 324032405
- 3000 St Unit 92
- 3000 Broadway St Unit 16
- 3000 Broadway St Unit 13
- 3000 Broadway St Unit 8
- 130 Kennison Ct
- 221 Rio Del Mar
- 219 Rio Del Mar
- 127 Entrada Cir
- 2041 Severus Dr
- 240 Rinaldo Dr
- 180 San Marco Way
- 597 Chaucer Ln
- 591 Chaucer Ln
- 585 Chaucer Ln
- 404 Bettona Way
- 176 San Marco Way
- 581 Chaucer Ln
- 163 San Marco Way
- 408 Bettona Way
- 172 San Marco Way
- 159 San Marco Way
- 705 Huntington Way
- 709 Huntington Way
- 713 Huntington Way
- 701 Huntington Way
- 596 Chaucer Ln
- 412 Bettona Way
- 590 Chaucer Ln
- 168 San Marco Way
- 409 Bettona Way