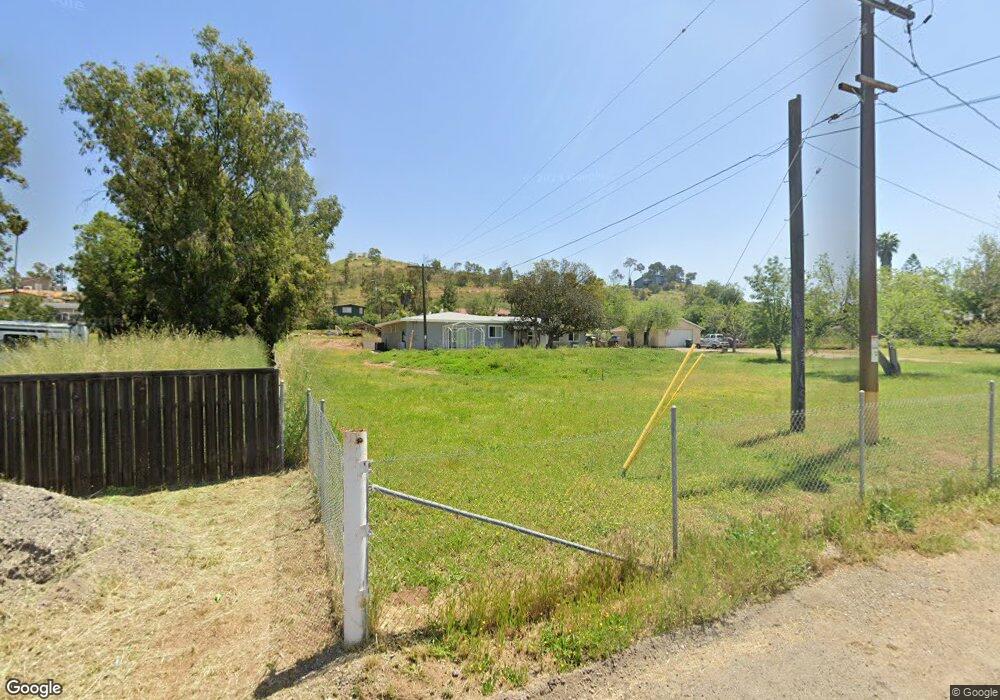
184 W Old Julian Hwy Ramona, CA 92065
Estimated Value: $792,916 - $892,000
4
Beds
2
Baths
2,457
Sq Ft
$347/Sq Ft
Est. Value
About This Home
This home is located at 184 W Old Julian Hwy, Ramona, CA 92065 and is currently estimated at $852,979, approximately $347 per square foot. 184 W Old Julian Hwy is a home located in San Diego County with nearby schools including Ramona Elementary School, Olive Peirce Middle School, and Ramona High School.
Ownership History
Date
Name
Owned For
Owner Type
Purchase Details
Closed on
Apr 28, 2021
Sold by
Hargrove Sparling Carol L and Sparling Thomas E
Bought by
Hargrove Sparling Carol L and Sparling Thomas E
Current Estimated Value
Home Financials for this Owner
Home Financials are based on the most recent Mortgage that was taken out on this home.
Original Mortgage
$151,000
Outstanding Balance
$136,844
Interest Rate
3.1%
Mortgage Type
New Conventional
Estimated Equity
$716,135
Purchase Details
Closed on
Sep 30, 2004
Sold by
Sparling Carol Lynn Hargrove and Hargrove Carol L
Bought by
Sparling Thomas E and Sparling Carol Lynn Hargrove
Home Financials for this Owner
Home Financials are based on the most recent Mortgage that was taken out on this home.
Original Mortgage
$115,200
Interest Rate
5.72%
Mortgage Type
Stand Alone Refi Refinance Of Original Loan
Purchase Details
Closed on
Jun 1, 1988
Create a Home Valuation Report for This Property
The Home Valuation Report is an in-depth analysis detailing your home's value as well as a comparison with similar homes in the area
Home Values in the Area
Average Home Value in this Area
Purchase History
| Date | Buyer | Sale Price | Title Company |
|---|---|---|---|
| Hargrove Sparling Carol L | -- | Western Resources Title | |
| Sparling Thomas E | -- | -- | |
| -- | $132,000 | -- |
Source: Public Records
Mortgage History
| Date | Status | Borrower | Loan Amount |
|---|---|---|---|
| Open | Hargrove Sparling Carol L | $151,000 | |
| Closed | Sparling Thomas E | $115,200 | |
| Closed | Sparling Thomas E | $95,000 |
Source: Public Records
Tax History Compared to Growth
Tax History
| Year | Tax Paid | Tax Assessment Tax Assessment Total Assessment is a certain percentage of the fair market value that is determined by local assessors to be the total taxable value of land and additions on the property. | Land | Improvement |
|---|---|---|---|---|
| 2025 | $3,066 | $261,815 | $32,176 | $229,639 |
| 2024 | $3,066 | $256,683 | $31,546 | $225,137 |
| 2023 | $2,629 | $251,651 | $30,928 | $220,723 |
| 2022 | $2,777 | $246,718 | $30,322 | $216,396 |
| 2021 | $2,729 | $241,881 | $29,728 | $212,153 |
| 2020 | $2,702 | $239,402 | $29,424 | $209,978 |
| 2019 | $2,638 | $234,709 | $28,848 | $205,861 |
| 2018 | $2,569 | $230,108 | $28,283 | $201,825 |
| 2017 | $2,520 | $225,597 | $27,729 | $197,868 |
| 2016 | $2,471 | $221,175 | $27,186 | $193,989 |
| 2015 | $2,437 | $217,854 | $26,778 | $191,076 |
| 2014 | $2,383 | $213,588 | $26,254 | $187,334 |
Source: Public Records
Map
Nearby Homes
- 0 Mussey Grade Rd Unit B 220023313
- 0 Mussey Grade Rd Unit C 220023312
- 0 Hwy 78 (Julian Rd) Unit SW21092588
- 539 Steffy Rd
- 161 Steffy Rd
- 322 G St
- 1566 Wilson Rd
- 333 Salmon Rd
- 1550 Keyes Rd
- 1608 Wilson Rd
- 0 Camino Arriba Unit 3 250034073
- 40 acres Sutherland Dam Rd
- 415 3rd St
- 722 8th St
- 18434 Ramona View Dr
- 915 9th St
- 19630 Camino Vista Unit 191
- 611 9th St
- 1121 11th St
- 742 A St Unit 1
- 1164 Tiger Way
- 160 W Old Julian Hwy
- 174 W Old Julian Hwy
- 1139 Tiger Way
- 168 W Old Julian Hwy
- 1139D Tiger Way Unit Parcel D
- 196 W Old Julian Hwy
- 164 W Old Julian Hwy
- 158 W Old Julian Hwy
- 329 Calle Amistad Dr
- 333 Calle Amistad Dr
- 0 Tiger Way
- 210 W Old Julian Hwy
- 365 Calle Amistad Dr
- 325 Calle Amistad Dr
- 152 W Old Julian Hwy
- 367 Calle Amistad Dr
- 727 Amigos Rd
- 317 Calle Amistad Dr
- 1128 Keyes Rd