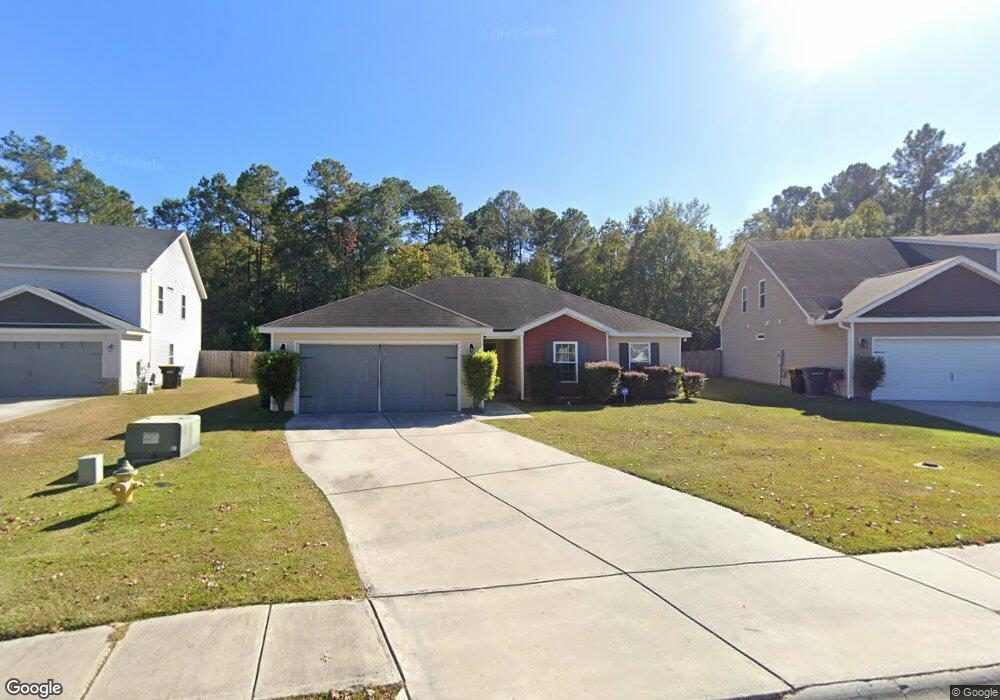
184 Waverly Way Savannah, GA 31407
Godley Station NeighborhoodEstimated Value: $299,922 - $326,000
3
Beds
2
Baths
1,493
Sq Ft
$210/Sq Ft
Est. Value
About This Home
This home is located at 184 Waverly Way, Savannah, GA 31407 and is currently estimated at $312,981, approximately $209 per square foot. 184 Waverly Way is a home located in Chatham County with nearby schools including Godley Station School, Groves High School, and Savannah Adventist Christian School.
Ownership History
Date
Name
Owned For
Owner Type
Purchase Details
Closed on
Jun 3, 2021
Sold by
Breckinridge Property Fund 2016 Llc
Bought by
Williams Joann and Williams John
Current Estimated Value
Home Financials for this Owner
Home Financials are based on the most recent Mortgage that was taken out on this home.
Original Mortgage
$147,000
Outstanding Balance
$133,090
Interest Rate
2.9%
Mortgage Type
New Conventional
Estimated Equity
$179,891
Purchase Details
Closed on
Apr 6, 2021
Sold by
Allen Edward
Bought by
Breckinridge Property Fund 2016 Llc
Home Financials for this Owner
Home Financials are based on the most recent Mortgage that was taken out on this home.
Original Mortgage
$147,000
Outstanding Balance
$133,090
Interest Rate
2.9%
Mortgage Type
New Conventional
Estimated Equity
$179,891
Purchase Details
Closed on
Aug 10, 2018
Sold by
Beacon Builders Inc
Bought by
Beacon New Homes Llc
Home Financials for this Owner
Home Financials are based on the most recent Mortgage that was taken out on this home.
Original Mortgage
$175,740
Interest Rate
4.5%
Create a Home Valuation Report for This Property
The Home Valuation Report is an in-depth analysis detailing your home's value as well as a comparison with similar homes in the area
Home Values in the Area
Average Home Value in this Area
Purchase History
| Date | Buyer | Sale Price | Title Company |
|---|---|---|---|
| Williams Joann | $222,000 | -- | |
| Breckinridge Property Fund 2016 Llc | $182,000 | -- | |
| Beacon New Homes Llc | -- | -- | |
| Allen Edward | $175,740 | -- |
Source: Public Records
Mortgage History
| Date | Status | Borrower | Loan Amount |
|---|---|---|---|
| Open | Williams Joann | $147,000 | |
| Previous Owner | Allen Edward | $175,740 |
Source: Public Records
Tax History Compared to Growth
Tax History
| Year | Tax Paid | Tax Assessment Tax Assessment Total Assessment is a certain percentage of the fair market value that is determined by local assessors to be the total taxable value of land and additions on the property. | Land | Improvement |
|---|---|---|---|---|
| 2025 | $2,209 | $118,400 | $22,000 | $96,400 |
| 2024 | $2,209 | $117,400 | $22,000 | $95,400 |
| 2023 | $586 | $101,440 | $15,800 | $85,640 |
| 2022 | $2,348 | $88,800 | $15,040 | $73,760 |
| 2021 | $3,328 | $76,160 | $15,800 | $60,360 |
| 2020 | $2,220 | $73,720 | $15,800 | $57,920 |
| 2019 | $3,124 | $70,320 | $15,611 | $54,709 |
| 2018 | $197 | $15,800 | $15,800 | $0 |
| 2017 | $197 | $15,800 | $15,800 | $0 |
Source: Public Records
Map
Nearby Homes
- 106 Spring Lakes Dr
- 225 Willow Point Cir
- 133 Spring Lakes Dr
- 126 Waverly Way
- 105 Archwood Dr
- 6 Spring Lake Cir
- 13 Twin Oaks Place
- 52 Hartland Ct
- 123 Wind Willow Dr
- 271 Willow Point Cir
- 28 Twin Oaks Place
- 34 Twin Oaks Place
- 137 Greyfield Cir
- 2 Havasu Lake Dr
- 15 Hawkhorn Ct
- 75 Fairgreen St
- 6 Falkland Ave
- 9 Sunbriar Ln
- 5 Sunbriar Ln
- 29 Godley Park Way