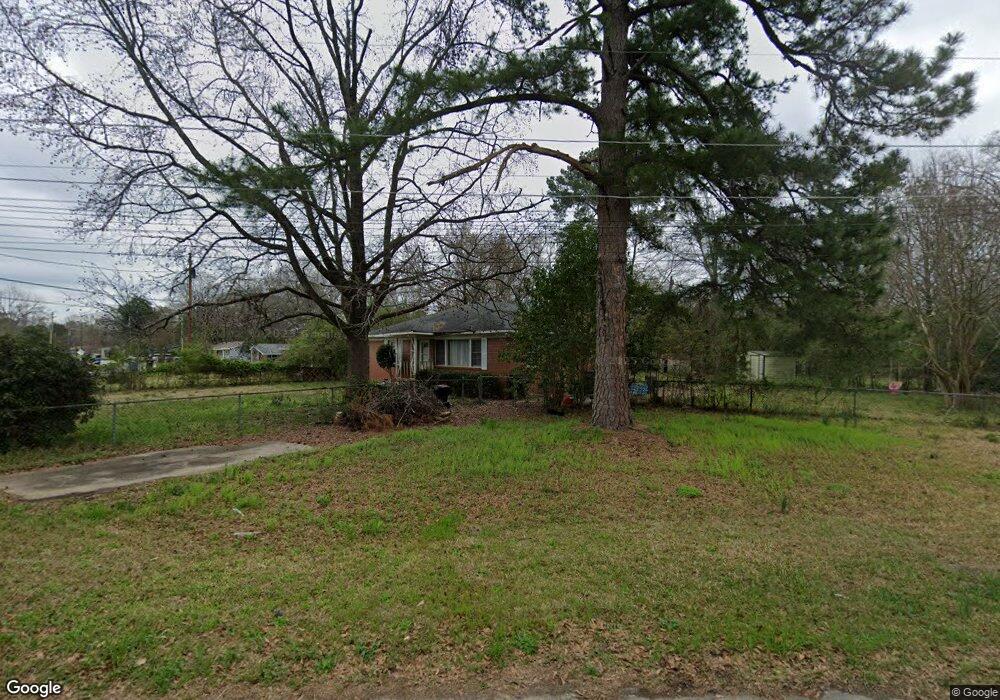
1840 Avalon Rd Columbus, GA 31907
Eastern Columbus NeighborhoodEstimated Value: $90,000 - $122,000
3
Beds
2
Baths
1,053
Sq Ft
$104/Sq Ft
Est. Value
About This Home
This home is located at 1840 Avalon Rd, Columbus, GA 31907 and is currently estimated at $109,779, approximately $104 per square foot. 1840 Avalon Rd is a home located in Muscogee County with nearby schools including Brewer Elementary School, Richards Middle School, and Hardaway High School.
Ownership History
Date
Name
Owned For
Owner Type
Purchase Details
Closed on
Aug 16, 2017
Sold by
Richard Darlington
Bought by
Jordan Sydney Q
Current Estimated Value
Home Financials for this Owner
Home Financials are based on the most recent Mortgage that was taken out on this home.
Original Mortgage
$41,900
Outstanding Balance
$34,962
Interest Rate
3.96%
Mortgage Type
New Conventional
Estimated Equity
$74,817
Purchase Details
Closed on
Jun 19, 2009
Sold by
Fannie Mae
Bought by
Darlington Stephanie and Darlington Richard
Home Financials for this Owner
Home Financials are based on the most recent Mortgage that was taken out on this home.
Original Mortgage
$60,680
Interest Rate
4.79%
Mortgage Type
FHA
Purchase Details
Closed on
Feb 3, 2009
Sold by
Litton Loan Servicing Lp
Bought by
Federal National Mortgage Association
Create a Home Valuation Report for This Property
The Home Valuation Report is an in-depth analysis detailing your home's value as well as a comparison with similar homes in the area
Home Values in the Area
Average Home Value in this Area
Purchase History
| Date | Buyer | Sale Price | Title Company |
|---|---|---|---|
| Jordan Sydney Q | $55,900 | -- | |
| Darlington Stephanie | -- | None Available | |
| Federal National Mortgage Association | -- | None Available | |
| Litton Loan Servicing Lp | $77,178 | None Available |
Source: Public Records
Mortgage History
| Date | Status | Borrower | Loan Amount |
|---|---|---|---|
| Open | Jordan Sydney Q | $41,900 | |
| Previous Owner | Darlington Stephanie | $60,680 |
Source: Public Records
Tax History Compared to Growth
Tax History
| Year | Tax Paid | Tax Assessment Tax Assessment Total Assessment is a certain percentage of the fair market value that is determined by local assessors to be the total taxable value of land and additions on the property. | Land | Improvement |
|---|---|---|---|---|
| 2025 | $359 | $37,768 | $11,468 | $26,300 |
| 2024 | $358 | $37,768 | $11,468 | $26,300 |
| 2023 | $19 | $37,768 | $11,468 | $26,300 |
| 2022 | $373 | $28,348 | $8,620 | $19,728 |
| 2021 | $366 | $22,076 | $8,620 | $13,456 |
| 2020 | $366 | $22,076 | $8,620 | $13,456 |
| 2019 | $369 | $22,076 | $8,620 | $13,456 |
| 2018 | $369 | $22,360 | $7,840 | $14,520 |
| 2017 | $680 | $24,576 | $8,620 | $15,956 |
| 2016 | $684 | $29,841 | $3,848 | $25,993 |
| 2015 | $685 | $29,841 | $3,848 | $25,993 |
| 2014 | $686 | $29,841 | $3,848 | $25,993 |
| 2013 | -- | $29,841 | $3,848 | $25,993 |
Source: Public Records
Map
Nearby Homes
- 1674 Forestside Dr
- 1918 Watkins Dr
- 4418 Gardiner Dr
- 1618 Forestside Dr
- 1544 Celia Dr
- 1433 Kevin Ct
- 911 Lamore St
- 4 Clausen Dr
- 4630 Gardiner Dr
- 3875 Mulberry Dr
- 0 Langdon St
- 4201 Forrest Rd
- 1404 Hunt Ave
- 3836 Mulberry Dr
- 4785 Gardiner Dr
- 1618 Edgechester Ave
- 3800 Woodmont Dr
- 3760 Mulberry Dr
- 4642 Wellborn Dr
- 4237 Fort St
- 4202 Snellings Dr
- 1828 Avalon Rd
- 4206 Snellings Dr
- 1821 Avalon Rd
- 1900 Avalon Rd
- 1841 Avalon Rd
- 4210 Snellings Dr
- 4209 Snellings Dr
- 1908 Avalon Rd
- 1903 Avalon Rd
- 4216 Snellings Dr
- 4213 Snellings Dr
- 1909 Avalon Rd
- 1813 Avalon Rd
- 4212 Barr St
- 1916 Avalon Rd
- 4219 Snellings Dr
- 4222 Snellings Dr
- 4218 Barr St
- 1915 Avalon Rd