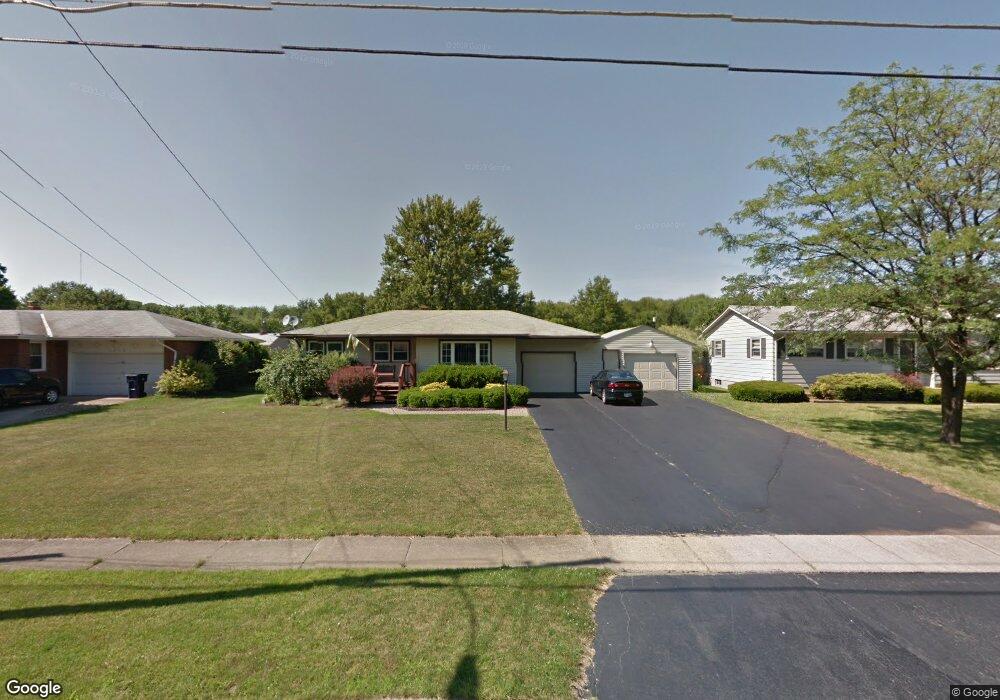
1840 Lealand Ave Youngstown, OH 44514
Estimated Value: $154,000 - $201,000
3
Beds
1
Bath
1,103
Sq Ft
$160/Sq Ft
Est. Value
About This Home
This home is located at 1840 Lealand Ave, Youngstown, OH 44514 and is currently estimated at $176,061, approximately $159 per square foot. 1840 Lealand Ave is a home located in Mahoning County with nearby schools including Poland Union Elementary School, Poland Middle School, and Poland Seminary High School.
Ownership History
Date
Name
Owned For
Owner Type
Purchase Details
Closed on
Apr 27, 2022
Sold by
Hines Kathy L
Bought by
Conn Nicholas
Current Estimated Value
Purchase Details
Closed on
Apr 1, 2006
Sold by
Smith Frederick J and Smith Lisa A
Bought by
Hines Richard F and Hines Kathy L
Home Financials for this Owner
Home Financials are based on the most recent Mortgage that was taken out on this home.
Original Mortgage
$44,000
Interest Rate
6.18%
Mortgage Type
Fannie Mae Freddie Mac
Purchase Details
Closed on
Jul 29, 1997
Sold by
Hunter Richard James and Hunter Yvonne
Bought by
Smith Frederick J and Smith Lisa A
Home Financials for this Owner
Home Financials are based on the most recent Mortgage that was taken out on this home.
Original Mortgage
$58,400
Interest Rate
7.71%
Purchase Details
Closed on
Jan 6, 1987
Bought by
Hunter Irene L
Create a Home Valuation Report for This Property
The Home Valuation Report is an in-depth analysis detailing your home's value as well as a comparison with similar homes in the area
Home Values in the Area
Average Home Value in this Area
Purchase History
| Date | Buyer | Sale Price | Title Company |
|---|---|---|---|
| Conn Nicholas | -- | -- | |
| Hines Kathy L | -- | -- | |
| Hines Kathy L | -- | -- | |
| Hines Richard F | $99,000 | None Available | |
| Smith Frederick J | $73,000 | -- | |
| Hunter Irene L | -- | -- |
Source: Public Records
Mortgage History
| Date | Status | Borrower | Loan Amount |
|---|---|---|---|
| Previous Owner | Hines Richard F | $44,000 | |
| Previous Owner | Smith Frederick J | $58,400 |
Source: Public Records
Tax History Compared to Growth
Tax History
| Year | Tax Paid | Tax Assessment Tax Assessment Total Assessment is a certain percentage of the fair market value that is determined by local assessors to be the total taxable value of land and additions on the property. | Land | Improvement |
|---|---|---|---|---|
| 2024 | $2,514 | $48,440 | $6,330 | $42,110 |
| 2023 | $2,484 | $48,440 | $6,330 | $42,110 |
| 2022 | $1,957 | $31,600 | $5,440 | $26,160 |
| 2021 | $1,961 | $31,600 | $5,440 | $26,160 |
| 2020 | $1,968 | $31,600 | $5,440 | $26,160 |
| 2019 | $1,736 | $24,880 | $4,280 | $20,600 |
| 2018 | $1,606 | $24,880 | $4,280 | $20,600 |
| 2017 | $1,584 | $24,880 | $4,280 | $20,600 |
| 2016 | $1,792 | $27,010 | $6,310 | $20,700 |
| 2015 | $1,758 | $27,010 | $6,310 | $20,700 |
| 2014 | $1,763 | $27,010 | $6,310 | $20,700 |
| 2013 | $1,743 | $27,010 | $6,310 | $20,700 |
Source: Public Records
Map
Nearby Homes
- 1859 Mathews Rd
- 1894 Lealand Ave
- 1890 Mathews Rd
- 0 Mathews Rd Unit 5149232
- 0 Mathews Rd Unit 5143059
- 0 Oles Ave
- 1804 Alverne Dr
- 0 Woodlawn Ave
- 1827 Alverne Dr
- 2035 Woodward Ave
- 1841 Wingate Rd
- 1738 Island Dr
- 1919 Wingate Rd
- 5710 Youngstown Poland Rd
- 34 Venloe Dr
- 43 Venloe Dr
- 1828 Basil Ave
- 2128 Lyon Blvd
- 2089 Shetland Ln
- 2153 Lyon Blvd
- 1846 Lealand Ave
- 1828 Lealand Ave
- 1852 Lealand Ave
- 1847 Lynn Mar Ave
- 1841 Lynn Mar Ave
- 1853 Lynn Mar Ave
- 1822 Lealand Ave
- 1835 Lynn Mar Ave
- 1841 Lealand Ave
- 1859 Lynn Mar Ave
- 1833 Lealand Ave
- 1858 Lealand Ave
- 1845 Lealand Ave
- 1829 Lynn Mar Ave
- 1857 Lealand Ave
- 1821 Lealand Ave
- 1818 Lealand Ave
- 1865 Lynn Mar Ave
- 1864 Lealand Ave
- 1863 Lealand Ave