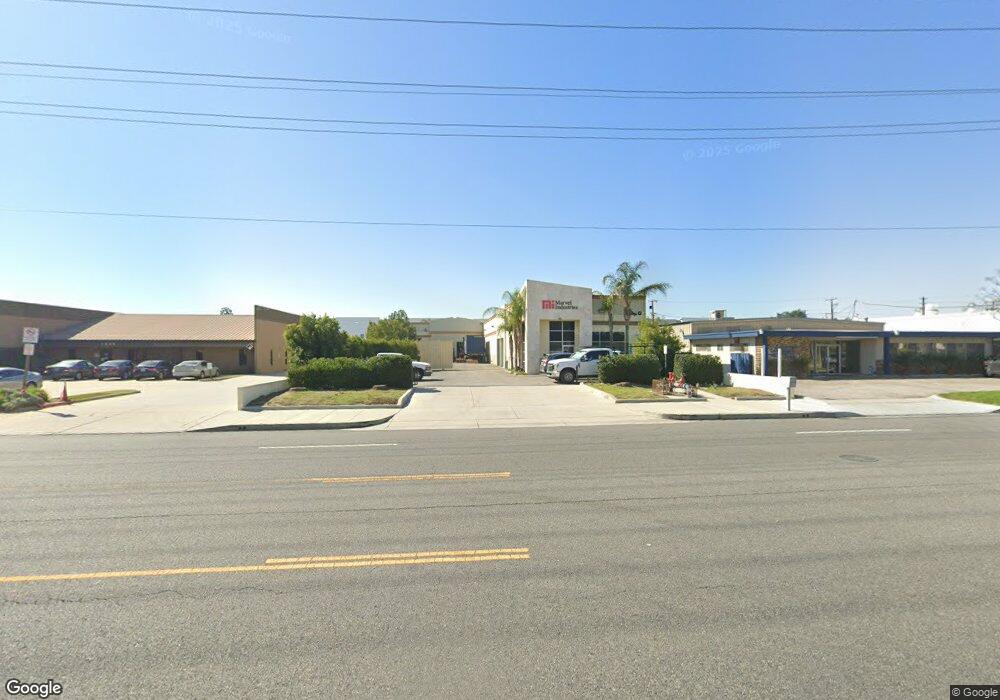
1840 S Baker Ave Ontario, CA 91761
Downtown Ontario NeighborhoodEstimated Value: $2,354,087
--
Bed
--
Bath
8,867
Sq Ft
$265/Sq Ft
Est. Value
About This Home
This home is located at 1840 S Baker Ave, Ontario, CA 91761 and is currently estimated at $2,354,087, approximately $265 per square foot. 1840 S Baker Ave is a home located in San Bernardino County with nearby schools including Bon View Elementary, De Anza Middle, and Colony High.
Ownership History
Date
Name
Owned For
Owner Type
Purchase Details
Closed on
Mar 4, 2015
Sold by
Rodriguez Oscar M and Rodriguez Isabel M
Bought by
Marvel Investment Llc
Current Estimated Value
Home Financials for this Owner
Home Financials are based on the most recent Mortgage that was taken out on this home.
Original Mortgage
$844,582
Outstanding Balance
$648,770
Interest Rate
3.76%
Mortgage Type
Commercial
Estimated Equity
$1,705,317
Purchase Details
Closed on
Jul 12, 2006
Sold by
Damos Arde and Damos Jacqueline M
Bought by
Rodriguez Oscar M and Rodriguez Isabel M
Home Financials for this Owner
Home Financials are based on the most recent Mortgage that was taken out on this home.
Original Mortgage
$700,000
Interest Rate
6.12%
Mortgage Type
Commercial
Purchase Details
Closed on
Oct 30, 2002
Sold by
Cogswell Eleanor
Bought by
Cogswell Ronald C
Purchase Details
Closed on
Oct 11, 2002
Sold by
Westenberger Stephen P and Cogswell Ronald C
Bought by
Damos Arde and Damos Jacqueline M
Create a Home Valuation Report for This Property
The Home Valuation Report is an in-depth analysis detailing your home's value as well as a comparison with similar homes in the area
Home Values in the Area
Average Home Value in this Area
Purchase History
| Date | Buyer | Sale Price | Title Company |
|---|---|---|---|
| Marvel Investment Llc | $1,126,500 | Fidelity National Title | |
| Rodriguez Oscar M | -- | Commonwealth | |
| Cogswell Ronald C | -- | Commonwealth Title | |
| Westenberger Stephen P | -- | Commonwealth Title | |
| Damos Arde | $125,000 | Commonwealth Title |
Source: Public Records
Mortgage History
| Date | Status | Borrower | Loan Amount |
|---|---|---|---|
| Open | Marvel Investment Llc | $844,582 | |
| Previous Owner | Rodriguez Oscar M | $700,000 |
Source: Public Records
Tax History Compared to Growth
Tax History
| Year | Tax Paid | Tax Assessment Tax Assessment Total Assessment is a certain percentage of the fair market value that is determined by local assessors to be the total taxable value of land and additions on the property. | Land | Improvement |
|---|---|---|---|---|
| 2025 | $14,515 | $1,353,885 | $275,224 | $1,078,661 |
| 2024 | $14,515 | $1,327,338 | $269,827 | $1,057,511 |
| 2023 | $14,106 | $1,301,311 | $264,536 | $1,036,775 |
| 2022 | $13,920 | $1,275,795 | $259,349 | $1,016,446 |
| 2021 | $13,835 | $1,250,780 | $254,264 | $996,516 |
| 2020 | $13,592 | $1,237,955 | $251,657 | $986,298 |
| 2019 | $13,475 | $1,213,682 | $246,723 | $966,959 |
| 2018 | $13,289 | $1,189,884 | $241,885 | $947,999 |
| 2017 | $12,805 | $1,166,553 | $237,142 | $929,411 |
| 2016 | $12,297 | $1,143,679 | $232,492 | $911,187 |
| 2015 | $5,095 | $468,755 | $148,773 | $319,982 |
| 2014 | $4,937 | $459,573 | $145,859 | $313,714 |
Source: Public Records
Map
Nearby Homes
- 3645 E Delight Paseo Unit 135
- 3641 E Eames St
- 1829 E Elm St
- 1456 E Philadelphia St Unit 134
- 1456 E Philadelphia St Unit 378
- 1456 E Philadelphia St
- 1456 E Philadelphia St Unit 279
- 1456 E Philadelphia St Unit 132
- 1456 E Philadelphia St Unit 39
- 1456 E Philadelphia St Unit 41
- 1456 E Philadelphia St Unit 311
- 1456 E Philadelphia St Unit 158
- 1456 E Philadelphia St Unit 109
- 1456 E Philadelphia St Unit 351
- 1456 E Philadelphia St Unit 154
- 1456 E Philadelphia St Unit 372
- 1456 E Philadelphia St Unit 331
- 1456 E Philadelphia St Unit 145
- 1456 E Philadelphia St Unit 182
- 1830 S Baker Ave
- 1630 E Francis St Unit B,J, N,O
- 1630 E Francis St
- 1651 Fremont Ct
- 1616 E Francis St
- 1615 Fremont Ct
- 1706 E Francis St
- 1601 Fremont Ct
- 1716 E Francis St
- 1620 Fremont Ct
- 1602 Fremont Ct
- 1756 E Francis St Unit B
- 1756 E Francis St
- 1730 E Francis St
- 1734 S Baker Ave
- 1736 E Francis St
- 1754 S Baker Ave
- 1748 S Baker Ave
- 1920 S Augusta Ave
- 1477 E Cedar St Unit F