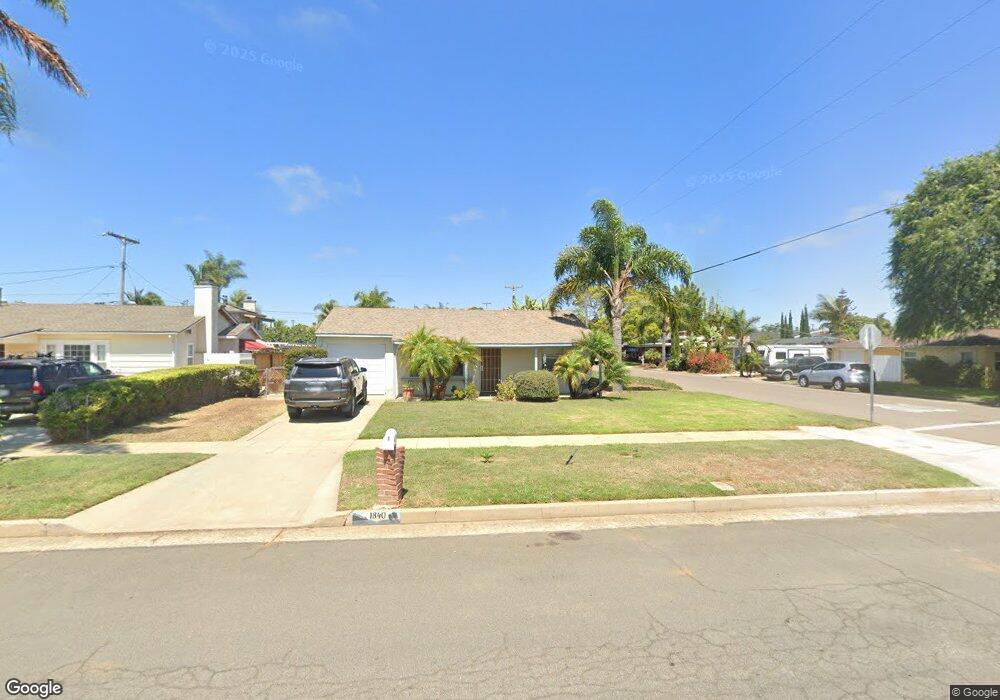
1840 S Ditmar St Oceanside, CA 92054
South Oceanside NeighborhoodEstimated Value: $991,079 - $1,328,000
2
Beds
1
Bath
792
Sq Ft
$1,513/Sq Ft
Est. Value
About This Home
This home is located at 1840 S Ditmar St, Oceanside, CA 92054 and is currently estimated at $1,198,270, approximately $1,512 per square foot. 1840 S Ditmar St is a home located in San Diego County with nearby schools including South Oceanside Elementary School, Lincoln Middle School, and Oceanside High School.
Ownership History
Date
Name
Owned For
Owner Type
Purchase Details
Closed on
Aug 15, 2014
Sold by
Foster Shirley
Bought by
Shirley Foster Trust and Anvaripour Aaron
Current Estimated Value
Purchase Details
Closed on
Oct 28, 2002
Sold by
Foster Shirley
Bought by
Foster Shirley
Purchase Details
Closed on
Nov 2, 1996
Sold by
Foster Jack E
Bought by
Foster Jack E and Foster Shirley
Create a Home Valuation Report for This Property
The Home Valuation Report is an in-depth analysis detailing your home's value as well as a comparison with similar homes in the area
Home Values in the Area
Average Home Value in this Area
Purchase History
| Date | Buyer | Sale Price | Title Company |
|---|---|---|---|
| Shirley Foster Trust | -- | None Available | |
| Foster Shirley | -- | -- | |
| Foster Shirley | -- | -- | |
| Foster Jack E | -- | -- |
Source: Public Records
Tax History
| Year | Tax Paid | Tax Assessment Tax Assessment Total Assessment is a certain percentage of the fair market value that is determined by local assessors to be the total taxable value of land and additions on the property. | Land | Improvement |
|---|---|---|---|---|
| 2025 | $552 | $45,683 | $23,074 | $22,609 |
| 2024 | $552 | $44,788 | $22,622 | $22,166 |
| 2023 | $535 | $43,911 | $22,179 | $21,732 |
| 2022 | $527 | $43,051 | $21,745 | $21,306 |
| 2021 | $529 | $42,208 | $21,319 | $20,889 |
| 2020 | $514 | $41,776 | $21,101 | $20,675 |
| 2019 | $500 | $40,958 | $20,688 | $20,270 |
| 2018 | $495 | $40,156 | $20,283 | $19,873 |
| 2017 | $486 | $39,370 | $19,886 | $19,484 |
| 2016 | $470 | $38,599 | $19,497 | $19,102 |
| 2015 | $457 | $38,021 | $19,205 | $18,816 |
| 2014 | $442 | $37,277 | $18,829 | $18,448 |
Source: Public Records
Map
Nearby Homes
- 1909-11 S Freeman St
- 1834 S Tremont St
- 1840 S Tremont St
- 1806 Stewart St
- 1822 Burroughs St
- 1921 S Myers St
- 2156 S Coast Hwy
- 2168 S Coast Hwy
- 1842-46 S Pacific St
- 1846 S Pacific St
- 2186 S Coast Hwy
- 920 Morse St
- 1931 S Pacific St
- 1573 Vista Del Mar Way Unit 4
- 1413 La Salina St
- 120 Sherri Ln
- 1451 Machado St
- 1738 Kurtz St
- 1470 Burroughs St
- 1504 Valencia St
- 1836 S Ditmar St
- 1830 S Ditmar St
- 1837 S Nevada St
- 1902 S Ditmar St
- 1833 S Nevada St
- 807 Kelly St
- 1829 S Nevada St
- 1826 S Ditmar St
- 1839 S Ditmar St
- 815 Kelly St
- 1833 S Ditmar St
- 1910 S Ditmar St
- 1825 S Nevada St
- 1829 S Ditmar St
- 1901 S Ditmar St
- 1822 S Ditmar St
- 821 Kelly St
- 1827 S Ditmar St
- 1905 S Ditmar St
- 1821 S Nevada St
Your Personal Tour Guide
Ask me questions while you tour the home.