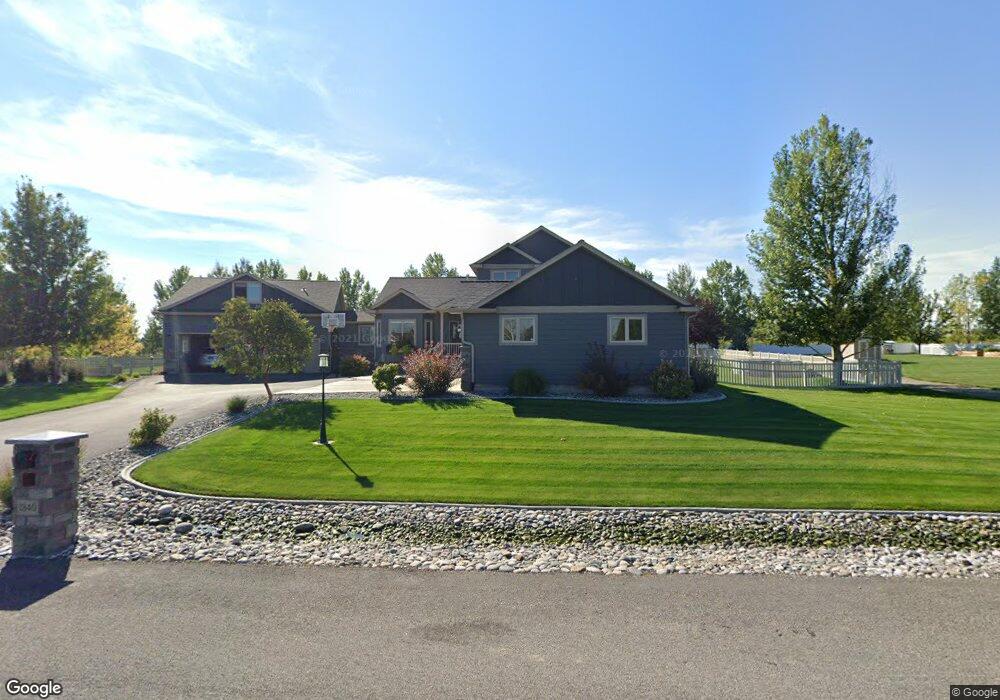
1840 Scarlet Sage Ln Laurel, MT 59044
Estimated Value: $687,875 - $784,000
4
Beds
3
Baths
2,346
Sq Ft
$310/Sq Ft
Est. Value
About This Home
This home is located at 1840 Scarlet Sage Ln, Laurel, MT 59044 and is currently estimated at $727,469, approximately $310 per square foot. 1840 Scarlet Sage Ln is a home located in Yellowstone County with nearby schools including Fred W. Graff School, West School, and Laurel Middle School.
Ownership History
Date
Name
Owned For
Owner Type
Purchase Details
Closed on
Jul 30, 2014
Sold by
Martin Alexander Newell and Martin Kristy Ann
Bought by
Schwend Robb
Current Estimated Value
Home Financials for this Owner
Home Financials are based on the most recent Mortgage that was taken out on this home.
Original Mortgage
$250,000
Outstanding Balance
$190,624
Interest Rate
4.11%
Mortgage Type
New Conventional
Estimated Equity
$536,845
Purchase Details
Closed on
Aug 12, 2008
Sold by
Beartooth Holding & Construction Inc
Bought by
Martin Alexander Newell and Martin Kristy Ann
Home Financials for this Owner
Home Financials are based on the most recent Mortgage that was taken out on this home.
Original Mortgage
$279,267
Interest Rate
6.32%
Mortgage Type
Unknown
Create a Home Valuation Report for This Property
The Home Valuation Report is an in-depth analysis detailing your home's value as well as a comparison with similar homes in the area
Home Values in the Area
Average Home Value in this Area
Purchase History
| Date | Buyer | Sale Price | Title Company |
|---|---|---|---|
| Schwend Robb | -- | None Available | |
| Martin Alexander Newell | -- | St | |
| Beartooth Holding & Construction Inc | -- | St |
Source: Public Records
Mortgage History
| Date | Status | Borrower | Loan Amount |
|---|---|---|---|
| Open | Schwend Robb | $250,000 | |
| Previous Owner | Martin Alexander Newell | $279,267 |
Source: Public Records
Tax History Compared to Growth
Tax History
| Year | Tax Paid | Tax Assessment Tax Assessment Total Assessment is a certain percentage of the fair market value that is determined by local assessors to be the total taxable value of land and additions on the property. | Land | Improvement |
|---|---|---|---|---|
| 2025 | $4,213 | $703,300 | $112,145 | $591,155 |
| 2024 | $4,213 | $582,200 | $99,638 | $482,562 |
| 2023 | $4,221 | $582,200 | $99,638 | $482,562 |
| 2022 | $3,717 | $494,200 | $0 | $0 |
| 2021 | $3,723 | $494,200 | $0 | $0 |
| 2020 | $3,130 | $394,600 | $0 | $0 |
| 2019 | $3,014 | $394,600 | $0 | $0 |
| 2018 | $3,114 | $351,200 | $0 | $0 |
| 2017 | $2,300 | $351,200 | $0 | $0 |
| 2016 | $2,896 | $346,500 | $0 | $0 |
| 2015 | $2,790 | $346,500 | $0 | $0 |
| 2014 | $2,566 | $168,593 | $0 | $0 |
Source: Public Records
Map
Nearby Homes
- 1665 Wild Lupine Ln
- 2604 Willow Wood Trail
- 1718 Pinyon Dr
- 2613 Willow Wood Trail
- 1805 E Maryland Ln
- 810 Piper Loop
- 802-816 Date Ave
- 1115 Sunhaven Dr
- 1108 E 8th St
- 1336 Pennsylvania Ave
- 1104 E 8th St
- 611 Elm Ave
- 1004 E 8th St
- 1008 Sunhaven Dr
- 1006 Sunhaven Dr
- 80th 74th St W
- 518 Date Ave
- 109 E 12th St
- 717 E 5th, 506 Alder Ave
- 1003 Montana Ave
- 000 Scarlet Sage Dr
- 0 Yard Office Rd
- 1820 Scarlet Sage Ln
- 1870 Scarlet Sage Ln
- 1855 Scarlet Sage Ln
- 1825 Scarlet Sage Ln
- 1900 Scarlet Sage Ln
- 2200 Morning Dove Dr
- 2155 Morning Dove Dr
- 1760 Wild Lupine Ln
- 2195 Morning Dove Dr
- 1905 Scarlet Sage Ln
- 1755 Wild Lupine Ln
- 2205 Morning Dove Dr
- 2130 Blue Sage Dr
- 2125 Quail Run
- 2230 Morning Dove Dr
- 2160 Blue Sage Dr
- 2225 Morning Dove Dr
- 2200 Blue Sage Dr