Estimated Value: $378,936 - $437,000
3
Beds
3
Baths
2,130
Sq Ft
$192/Sq Ft
Est. Value
About This Home
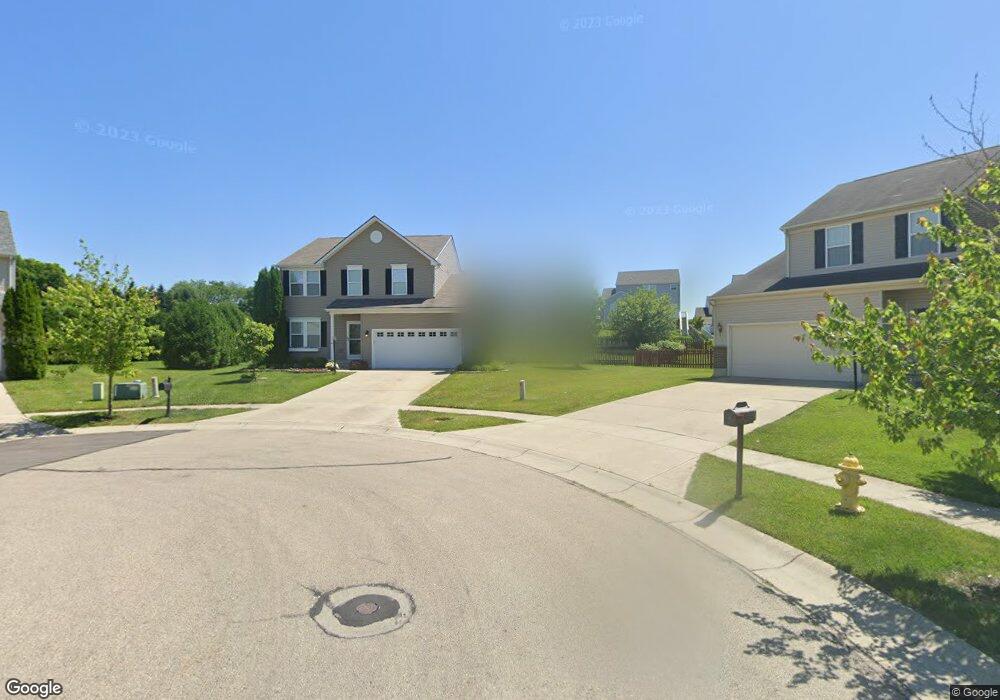
This home is located at 1840 Spring Ridge Ct, Xenia, OH 45385 and is currently estimated at $408,484, approximately $191 per square foot. 1840 Spring Ridge Ct is a home located in Greene County with nearby schools including Trebein Elementary School, Jacob Coy Middle School, and Beavercreek High School.
Ownership History
Date
Name
Owned For
Owner Type
Purchase Details
Closed on
Nov 27, 2013
Sold by
Didonato Stephanie L and Didonato Jack
Bought by
Peterson Tara M and Peterson Collin H
Current Estimated Value
Home Financials for this Owner
Home Financials are based on the most recent Mortgage that was taken out on this home.
Original Mortgage
$225,625
Outstanding Balance
$168,373
Interest Rate
4.17%
Mortgage Type
New Conventional
Estimated Equity
$240,111
Purchase Details
Closed on
Jan 21, 2009
Sold by
Nvr Inc
Bought by
Hill Stephanie L
Purchase Details
Closed on
Oct 17, 2008
Sold by
Bfd New Germany Trebein Ltd
Bought by
Nvr Inc
Purchase Details
Closed on
May 13, 2008
Sold by
Nvr Inc
Bought by
Bfd New Germany Trebein Ltd
Purchase Details
Closed on
Apr 7, 2008
Sold by
Bfd New Germany Trebein Ltd
Bought by
Nvr Inc
Create a Home Valuation Report for This Property
The Home Valuation Report is an in-depth analysis detailing your home's value as well as a comparison with similar homes in the area
Home Values in the Area
Average Home Value in this Area
Purchase History
| Date | Buyer | Sale Price | Title Company |
|---|---|---|---|
| Peterson Tara M | $237,500 | None Available | |
| Hill Stephanie L | $223,100 | None Available | |
| Nvr Inc | $53,900 | None Available | |
| Bfd New Germany Trebein Ltd | -- | None Available | |
| Nvr Inc | $53,900 | None Available |
Source: Public Records
Mortgage History
| Date | Status | Borrower | Loan Amount |
|---|---|---|---|
| Open | Peterson Tara M | $225,625 |
Source: Public Records
Tax History Compared to Growth
Tax History
| Year | Tax Paid | Tax Assessment Tax Assessment Total Assessment is a certain percentage of the fair market value that is determined by local assessors to be the total taxable value of land and additions on the property. | Land | Improvement |
|---|---|---|---|---|
| 2024 | $6,096 | $105,120 | $27,350 | $77,770 |
| 2023 | $6,096 | $105,120 | $27,350 | $77,770 |
| 2022 | $5,833 | $87,800 | $22,790 | $65,010 |
| 2021 | $5,896 | $86,790 | $22,790 | $64,000 |
| 2020 | $5,866 | $86,790 | $22,790 | $64,000 |
| 2019 | $5,594 | $75,760 | $16,250 | $59,510 |
| 2018 | $4,912 | $75,760 | $16,250 | $59,510 |
| 2017 | $4,832 | $75,760 | $16,250 | $59,510 |
| 2016 | $4,768 | $72,220 | $16,250 | $55,970 |
| 2015 | $4,805 | $72,220 | $16,250 | $55,970 |
| 2014 | $4,706 | $72,220 | $16,250 | $55,970 |
Source: Public Records
Map
Nearby Homes
- 1878 Spring Meadows Dr
- 1788 Fawnwood Ct
- 1922 Spring Ridge Dr
- 1105 Windsong Trail
- 1281 Whitetail Dr
- 1395 Brookstone Dr
- 508 Glenhaven Way Unit 756-300
- 506 Glenhaven Way Unit 756-204
- 516 Glenhaven Way Unit 756-304
- 502 Glenhaven Way Unit 756-202
- 500 Glenhaven Way Unit 756-201
- 510 Glenhaven Way Unit 756-301
- 456 Glenhaven Way Unit 754-304
- 474 Glenhaven Way Unit 755-303
- 518 Glenhaven Way Unit 756-305
- 470 Glenhaven Way Unit 755-301
- 464 Glenhaven Way Unit 755-203
- 462 Glenhaven Way Unit 755-202
- 2657 Verdant Ln Unit 759-304
- 2655 Verdant Ln Unit 759-303
- 1844 Spring Ridge Ct
- 1841 Spring Ridge Ct
- 1138 Spring Ridge Ct
- 2801 Ridge View Ct
- 2795 Ridge View Ct
- 2805 Ridge View Ct
- 1848 Spring Ridge Ct
- 1845 Daffodil Ct
- 2789 Ridge View Ct
- 1845 Spring Ridge Ct
- 1852 Spring Ridge Ct
- 1841 Daffodil Ct
- 2809 Ridge View Ct
- 2783 Ridge View Ct
- 1849 Daffodil Ct
- 1856 Spring Ridge Ct
- 1853 Spring Ridge Ct
- 2815 Ridge View Ct
- 2794 Ridge View Ct
- 1859 Spring Ridge Ct