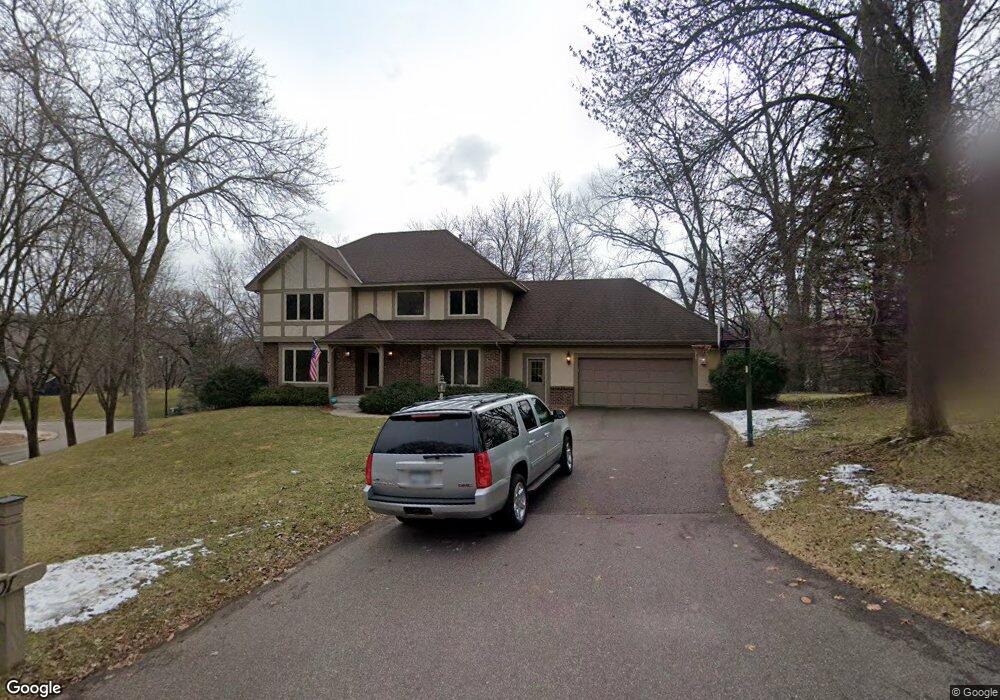
18401 Highpath Ln Minnetonka, MN 55345
Sparrow NeighborhoodEstimated Value: $769,690 - $874,000
4
Beds
4
Baths
3,102
Sq Ft
$261/Sq Ft
Est. Value
About This Home
This home is located at 18401 Highpath Ln, Minnetonka, MN 55345 and is currently estimated at $808,423, approximately $260 per square foot. 18401 Highpath Ln is a home located in Hennepin County with nearby schools including Deephaven Elementary School, Minnetonka East Middle School, and Minnetonka Senior High School.
Ownership History
Date
Name
Owned For
Owner Type
Purchase Details
Closed on
Sep 10, 2021
Sold by
Tehrani Pezhman Samimian and Zardosht Setareh
Bought by
Schnabl Ryan and Schnabl Emily M
Current Estimated Value
Home Financials for this Owner
Home Financials are based on the most recent Mortgage that was taken out on this home.
Original Mortgage
$565,000
Outstanding Balance
$514,108
Interest Rate
2.8%
Mortgage Type
VA
Estimated Equity
$294,315
Purchase Details
Closed on
Jun 2, 2016
Sold by
Kalscheuer Donald E and Kalscheuer Patricia M
Bought by
Tehrani Pezhman Samimian and Zardosht Setareh
Home Financials for this Owner
Home Financials are based on the most recent Mortgage that was taken out on this home.
Original Mortgage
$396,800
Interest Rate
2.89%
Mortgage Type
New Conventional
Create a Home Valuation Report for This Property
The Home Valuation Report is an in-depth analysis detailing your home's value as well as a comparison with similar homes in the area
Home Values in the Area
Average Home Value in this Area
Purchase History
| Date | Buyer | Sale Price | Title Company |
|---|---|---|---|
| Schnabl Ryan | $665,000 | All American Title Company | |
| Schnabl Ryan | -- | All American Title Company | |
| Tehrani Pezhman Samimian | $496,000 | Title Recording Services Inc | |
| Tehrani Pezhman Samimian | $496,000 | Title Recording Services Inc |
Source: Public Records
Mortgage History
| Date | Status | Borrower | Loan Amount |
|---|---|---|---|
| Open | Schnabl Ryan | $565,000 | |
| Closed | Schnabl Ryan | $565,000 | |
| Previous Owner | Tehrani Pezhman Samimian | $396,800 |
Source: Public Records
Tax History
| Year | Tax Paid | Tax Assessment Tax Assessment Total Assessment is a certain percentage of the fair market value that is determined by local assessors to be the total taxable value of land and additions on the property. | Land | Improvement |
|---|---|---|---|---|
| 2024 | $7,344 | $697,300 | $213,400 | $483,900 |
| 2023 | $6,906 | $693,700 | $213,400 | $480,300 |
| 2022 | $7,163 | $684,900 | $213,400 | $471,500 |
| 2021 | $6,992 | $516,400 | $184,000 | $332,400 |
| 2020 | $7,096 | $507,100 | $184,000 | $323,100 |
| 2019 | $6,881 | $494,200 | $184,000 | $310,200 |
| 2018 | $6,306 | $477,100 | $184,000 | $293,100 |
| 2017 | $6,348 | $434,100 | $173,200 | $260,900 |
| 2016 | $6,313 | $430,300 | $155,000 | $275,300 |
| 2015 | $6,281 | $425,300 | $150,000 | $275,300 |
| 2014 | -- | $384,500 | $150,000 | $234,500 |
Source: Public Records
Map
Nearby Homes
- 19002 Old Excelsior Blvd
- 18213 Hermitage Way
- 5034 Sparrow Rd
- 5125 Stoney Bridge Ct
- 18917 Chestnut Ln
- 4918 West Ln
- 4645 Eastwood Rd
- 5210 Shady Ln
- 5311 Tracy Lynn Terrace
- 5324 Spring Ln
- 18995 Maple Ln
- 5510 Mahoney Ave
- 5420 Spring Ln
- 4943 Bayswater Rd
- 5349 Shady Hills Cir
- 17155 Sandy Ln
- 19670 Excelsior Blvd
- 5536 Kipling Ave
- 5534 Conifer Trail
- 5616 Mahoney Ave
- 18411 Highpath Ln
- 18404 Beaverwood Hill
- 4920 Sparrow Rd
- 18410 Highpath Ln
- 18420 Highpath Ln
- 18421 Highpath Ln
- 5001 Sparrow Rd
- 4921 Sparrow Rd
- 5009 Sparrow Rd
- 5019 Sparrow Rd
- 4939 Sparrow Rd
- 18411 Beaverwood Hill
- 18411 Beaverwood Hill
- 18430 Highpath Ln
- 18500 South Ln
- 18431 Highpath Ln
- 4919 Sparrow Rd
- 5024 Sparrow Rd
- 18441 Highpath Ln
- 5031 Sparrow Rd
Your Personal Tour Guide
Ask me questions while you tour the home.