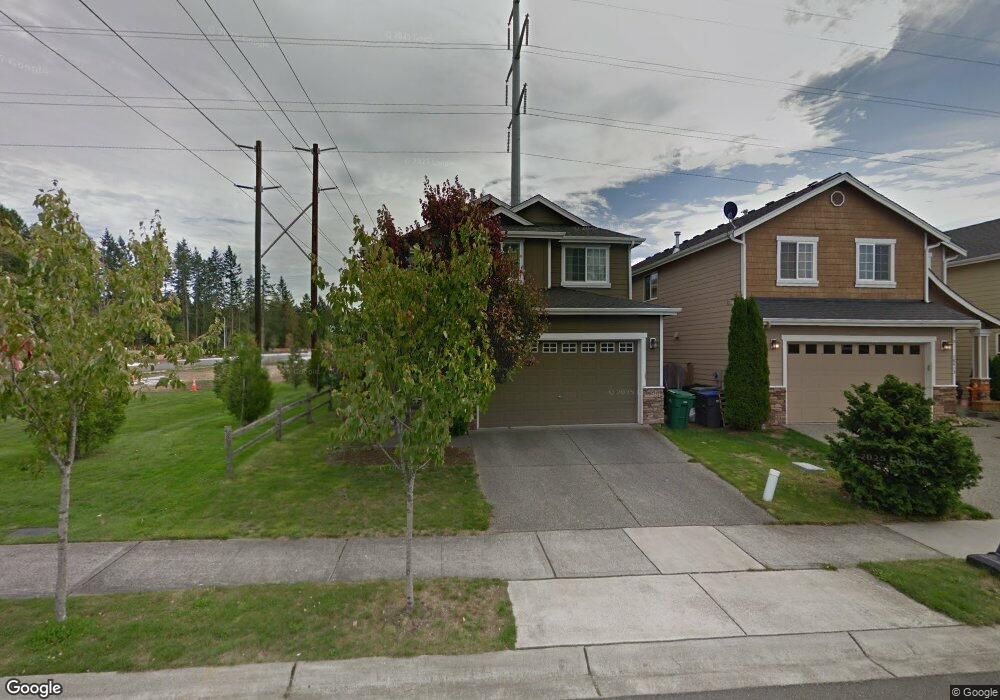
18407 42nd Ave SE Unit Lt 40 Bothell, WA 98012
North Creek NeighborhoodEstimated Value: $1,097,000 - $1,186,000
4
Beds
4
Baths
2,482
Sq Ft
$463/Sq Ft
Est. Value
About This Home
This home is located at 18407 42nd Ave SE Unit Lt 40, Bothell, WA 98012 and is currently estimated at $1,148,930, approximately $462 per square foot. 18407 42nd Ave SE Unit Lt 40 is a home located in Snohomish County with nearby schools including Fernwood Elementary School, Skyview Middle School, and North Creek High School.
Ownership History
Date
Name
Owned For
Owner Type
Purchase Details
Closed on
Aug 11, 2020
Sold by
Hallenbeck Patrick K and Hallenbeck Chelsea
Bought by
Hallenbeck Patrick K and Hallenbeck Chelsea
Current Estimated Value
Home Financials for this Owner
Home Financials are based on the most recent Mortgage that was taken out on this home.
Original Mortgage
$283,699
Outstanding Balance
$248,238
Interest Rate
3%
Mortgage Type
FHA
Estimated Equity
$900,692
Purchase Details
Closed on
Apr 14, 2010
Sold by
Frontier Bank
Bought by
Hallenbeck Patrick K
Home Financials for this Owner
Home Financials are based on the most recent Mortgage that was taken out on this home.
Original Mortgage
$343,660
Interest Rate
5.5%
Mortgage Type
FHA
Purchase Details
Closed on
Nov 23, 2009
Sold by
C S Inc
Bought by
Frontier Bank
Create a Home Valuation Report for This Property
The Home Valuation Report is an in-depth analysis detailing your home's value as well as a comparison with similar homes in the area
Home Values in the Area
Average Home Value in this Area
Purchase History
We collect this data history from publicly available records. To have your information removed, we recommend requesting removal directly through your county’s website.
| Date | Buyer | Sale Price | Title Company |
|---|---|---|---|
| Hallenbeck Patrick K | -- | Fidelity National Title | |
| Hallenbeck Patrick K | $350,280 | Pnwt | |
| Frontier Bank | $316,694 | None Available |
Source: Public Records
Mortgage History
We collect this data history from publicly available records. To have your information removed, we recommend requesting removal directly through your county’s website.
| Date | Status | Borrower | Loan Amount |
|---|---|---|---|
| Open | Hallenbeck Patrick K | $283,699 | |
| Closed | Hallenbeck Patrick K | $343,660 |
Source: Public Records
Tax History
| Year | Tax Paid | Tax Assessment Tax Assessment Total Assessment is a certain percentage of the fair market value that is determined by local assessors to be the total taxable value of land and additions on the property. | Land | Improvement |
|---|---|---|---|---|
| 2026 | $8,506 | $1,114,400 | $751,500 | $362,900 |
| 2025 | $7,751 | $965,300 | $616,500 | $348,800 |
| 2024 | $7,751 | $879,400 | $542,700 | $336,700 |
| 2023 | $7,994 | $1,012,800 | $625,500 | $387,300 |
| 2022 | $6,942 | $697,700 | $369,000 | $328,700 |
| 2020 | $6,162 | $584,100 | $283,100 | $301,000 |
| 2019 | $5,674 | $544,500 | $246,500 | $298,000 |
| 2018 | $5,307 | $474,200 | $208,300 | $265,900 |
| 2017 | $4,613 | $420,100 | $170,000 | $250,100 |
| 2016 | $4,597 | $399,500 | $136,000 | $263,500 |
| 2015 | $4,357 | $359,300 | $123,300 | $236,000 |
| 2013 | $3,837 | $281,100 | $116,500 | $164,600 |
Source: Public Records
Map
Nearby Homes
- 4319 186th Place SE
- 18521 40th Ave SE
- 4416 185th Place SE
- 18726 43rd Dr SE
- 18530 46th Ave SE
- 17913 38th Dr SE Unit 20
- 4117 177th Place SE
- 3514 184th Place SE
- 18612 51st Ave SE
- 3931 177th St SE
- 17905 35th Ave SE Unit B4
- 18801 34th Ave SE
- 19210 38th Ave SE
- 17633 48th Ave SE
- 3605 192nd St SE Unit B
- 19230 37th Dr SE Unit 4
- 19230 37th Dr SE
- 121 171st Place SW Unit B
- 17903 33rd Ave SE
- 3520 192nd Place SE
- 18407 42nd Ave SE
- 18413 42nd Ave SE
- 18417 42nd Ave SE
- 18421 42nd Ave SE Unit Lt 43
- 18421 42nd Ave SE
- 18410 42nd Ave SE Unit Lt 39
- 18410 42nd Ave SE
- 18414 42nd Ave SE Unit Lt 38
- 18414 42nd Ave SE
- 18425 42nd Ave SE Unit Lt 44
- 18425 42nd Ave SE
- 18418 42nd Ave SE
- 18418 42nd Ave SE Unit Lt 37
- 18418 42nd Ave SE
- 18422 42nd Ave SE
- 18429 42nd Ave SE
- 18426 42nd Ave SE Unit Lt 35
- 18426 42nd Ave SE
- 18411 41st Dr SE Unit Lt 13
- 18411 41st Dr SE
Your Personal Tour Guide
Ask me questions while you tour the home.