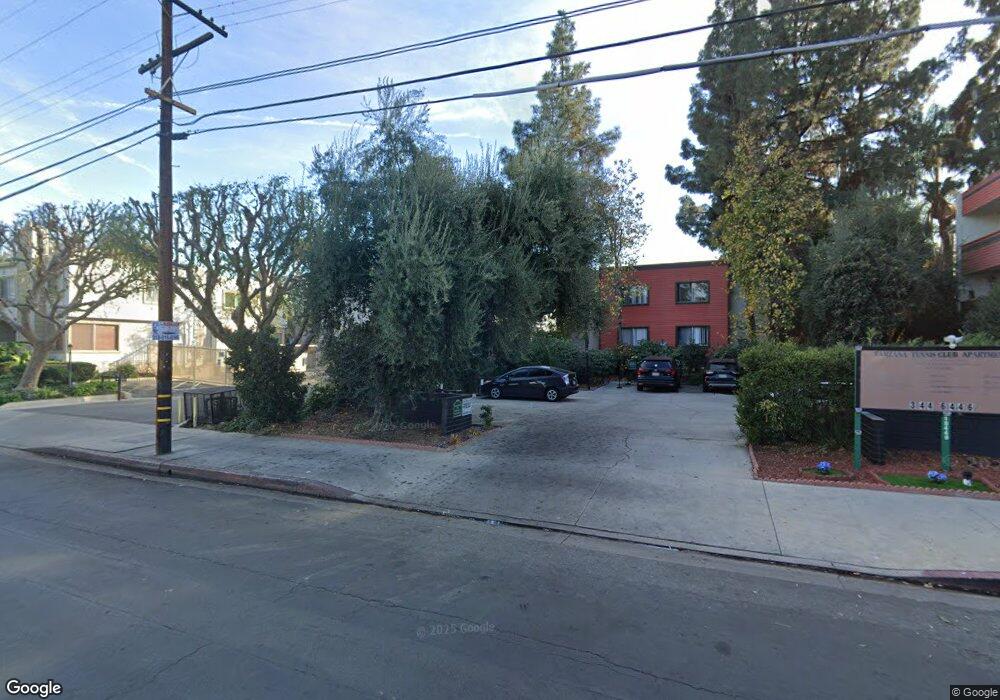
18408 Hatteras St Unit 31 Tarzana, CA 91356
Estimated Value: $414,870 - $473,000
2
Beds
1
Bath
871
Sq Ft
$502/Sq Ft
Est. Value
About This Home
This home is located at 18408 Hatteras St Unit 31, Tarzana, CA 91356 and is currently estimated at $437,468, approximately $502 per square foot. 18408 Hatteras St Unit 31 is a home located in Los Angeles County with nearby schools including Gaspar De Portola Middle School, Emelita Street Elementary, and Reseda High School.
Ownership History
Date
Name
Owned For
Owner Type
Purchase Details
Closed on
Dec 4, 2002
Sold by
Mcdevitt Kelly
Bought by
Robles Antonio
Current Estimated Value
Home Financials for this Owner
Home Financials are based on the most recent Mortgage that was taken out on this home.
Original Mortgage
$133,600
Outstanding Balance
$55,816
Interest Rate
5.86%
Estimated Equity
$381,652
Purchase Details
Closed on
Nov 6, 1996
Sold by
Great Western Bank
Bought by
Mcdevitt Kelly
Home Financials for this Owner
Home Financials are based on the most recent Mortgage that was taken out on this home.
Original Mortgage
$40,350
Interest Rate
7.53%
Purchase Details
Closed on
Dec 27, 1994
Sold by
Davenport Nancy and Great Western Bank
Bought by
Great Western Bank
Create a Home Valuation Report for This Property
The Home Valuation Report is an in-depth analysis detailing your home's value as well as a comparison with similar homes in the area
Home Values in the Area
Average Home Value in this Area
Purchase History
| Date | Buyer | Sale Price | Title Company |
|---|---|---|---|
| Robles Antonio | $167,000 | Southland Title Company | |
| Mcdevitt Kelly | $42,500 | Chicago Title Company | |
| Great Western Bank | $36,097 | Chicago Title Company |
Source: Public Records
Mortgage History
| Date | Status | Borrower | Loan Amount |
|---|---|---|---|
| Open | Robles Antonio | $133,600 | |
| Previous Owner | Mcdevitt Kelly | $40,350 | |
| Closed | Robles Antonio | $33,400 |
Source: Public Records
Tax History Compared to Growth
Tax History
| Year | Tax Paid | Tax Assessment Tax Assessment Total Assessment is a certain percentage of the fair market value that is determined by local assessors to be the total taxable value of land and additions on the property. | Land | Improvement |
|---|---|---|---|---|
| 2025 | $2,992 | $241,844 | $120,345 | $121,499 |
| 2024 | $2,992 | $237,103 | $117,986 | $119,117 |
| 2023 | $2,935 | $232,455 | $115,673 | $116,782 |
| 2022 | $2,798 | $227,898 | $113,405 | $114,493 |
| 2021 | $2,761 | $223,431 | $111,182 | $112,249 |
| 2019 | $2,679 | $216,806 | $107,885 | $108,921 |
| 2018 | $2,651 | $212,556 | $105,770 | $106,786 |
| 2016 | $2,527 | $204,305 | $101,664 | $102,641 |
| 2015 | $2,491 | $201,237 | $100,137 | $101,100 |
| 2014 | $2,506 | $197,296 | $98,176 | $99,120 |
Source: Public Records
Map
Nearby Homes
- 18411 Hatteras St Unit 114
- 18411 Hatteras St Unit 122
- 18411 Hatteras St Unit 106
- 18417 Collins St Unit A
- 18403 Collins St Unit D
- 18350 Hatteras St Unit 183
- 18350 Hatteras St Unit 176
- 18350 Hatteras St Unit 253
- 18350 Hatteras St Unit 267
- 18350 Hatteras St Unit 248
- 18350 Hatteras St Unit 132
- 5835 Etiwanda Ave
- 18530 Hatteras St Unit 326
- 18530 Hatteras St Unit 239
- 18530 Hatteras St Unit 115
- 18530 Hatteras St Unit 309
- 18530 Hatteras St Unit 313
- 18530 Hatteras St Unit 102
- 18530 Hatteras St Unit 332
- 5715 Etiwanda Ave Unit 4
- 18408 Hatteras St
- 18408 Hatteras St
- 18408 Hatteras St Unit 4
- 18408 Hatteras St Unit 48
- 18408 Hatteras St Unit 46
- 18408 Hatteras St Unit 44
- 18408 Hatteras St Unit 42
- 18408 Hatteras St Unit 40
- 18408 Hatteras St Unit 38
- 18408 Hatteras St Unit 36
- 18408 Hatteras St Unit 34
- 18408 Hatteras St Unit 32
- 18408 Hatteras St Unit 30
- 18408 Hatteras St Unit 26
- 18408 Hatteras St Unit 24
- 18408 Hatteras St Unit 14
- 18408 Hatteras St Unit 12
- 18408 Hatteras St Unit 10
- 18408 Hatteras St Unit 8
- 18408 Hatteras St Unit 58