Estimated Value: $225,261 - $255,000
2
Beds
1
Bath
1,134
Sq Ft
$211/Sq Ft
Est. Value
About This Home
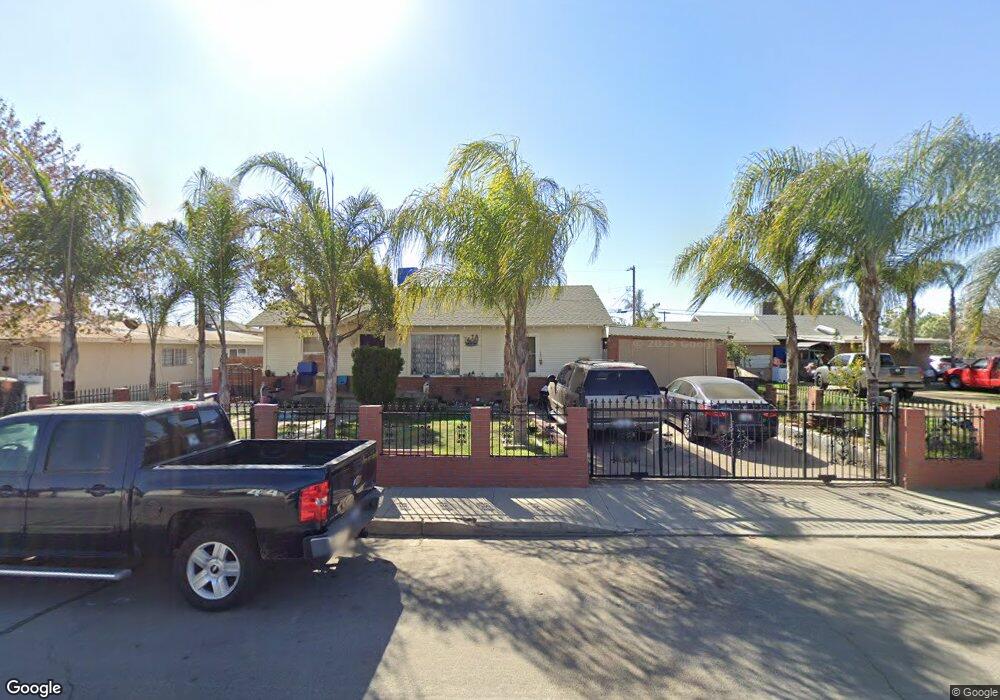
This home is located at 1841 4th St, Wasco, CA 93280 and is currently estimated at $239,315, approximately $211 per square foot. 1841 4th St is a home located in Kern County with nearby schools including Thomas Jefferson Middle School, Palm Avenue Elementary School, and Wasco High School.
Ownership History
Date
Name
Owned For
Owner Type
Purchase Details
Closed on
Jul 16, 2007
Sold by
Villanueva Villanueva Francisco Ramirez Francisco Ramirez and Villanueva Ramirez Francisco
Bought by
Villanueva Francisco Ramirez
Current Estimated Value
Home Financials for this Owner
Home Financials are based on the most recent Mortgage that was taken out on this home.
Original Mortgage
$129,500
Outstanding Balance
$81,909
Interest Rate
6.73%
Mortgage Type
New Conventional
Estimated Equity
$157,406
Purchase Details
Closed on
Jan 27, 1995
Sold by
Hill Marie J Kirby and Kirby Jewell
Bought by
Ramirez Francisco Villanueva
Home Financials for this Owner
Home Financials are based on the most recent Mortgage that was taken out on this home.
Original Mortgage
$68,916
Interest Rate
9.2%
Mortgage Type
FHA
Purchase Details
Closed on
Jan 12, 1994
Sold by
Villanueva Maria
Bought by
Ramirez Francisco Villanueva
Create a Home Valuation Report for This Property
The Home Valuation Report is an in-depth analysis detailing your home's value as well as a comparison with similar homes in the area
Home Values in the Area
Average Home Value in this Area
Purchase History
We collect this data history from publicly available records. To have your information removed, we recommend requesting removal directly through your county’s website.
| Date | Buyer | Sale Price | Title Company |
|---|---|---|---|
| Villanueva Francisco Ramirez | -- | Stewart Title Of Ca Inc | |
| Ramirez Francisco Villanueva | $69,000 | Chicago Title Company | |
| Ramirez Francisco Villanueva | -- | Chicago Title Company |
Source: Public Records
Mortgage History
We collect this data history from publicly available records. To have your information removed, we recommend requesting removal directly through your county’s website.
| Date | Status | Borrower | Loan Amount |
|---|---|---|---|
| Open | Villanueva Francisco Ramirez | $129,500 | |
| Closed | Ramirez Francisco Villanueva | $68,916 |
Source: Public Records
Tax History
| Year | Tax Paid | Tax Assessment Tax Assessment Total Assessment is a certain percentage of the fair market value that is determined by local assessors to be the total taxable value of land and additions on the property. | Land | Improvement |
|---|---|---|---|---|
| 2025 | $1,573 | $115,865 | $25,178 | $90,687 |
| 2024 | $1,573 | $113,594 | $24,685 | $88,909 |
| 2023 | $1,529 | $111,367 | $24,201 | $87,166 |
| 2022 | $1,466 | $109,184 | $23,727 | $85,457 |
| 2021 | $1,444 | $107,044 | $23,262 | $83,782 |
| 2020 | $1,347 | $105,947 | $23,024 | $82,923 |
| 2019 | $1,339 | $105,947 | $23,024 | $82,923 |
| 2018 | $1,344 | $101,835 | $22,131 | $79,704 |
| 2017 | $1,310 | $99,840 | $21,698 | $78,142 |
| 2016 | $1,199 | $97,883 | $21,273 | $76,610 |
| 2015 | $1,170 | $96,414 | $20,954 | $75,460 |
| 2014 | $914 | $74,000 | $19,000 | $55,000 |
Source: Public Records
Map
Nearby Homes
- 1917 3rd St
- 1622 6th St
- 625 Cedar Ave
- 2409 Alpine Meadow Ct
- 2326 Sycamore St
- 2518 7th St
- 2418 Sycamore St
- Lot #163 Track #1226
- 1780 Ironbark St
- 318 Adams St
- 1903 Penelope Ave
- 2550 Sycamore Ct
- 374 Broadway St
- 1009 Rosewood Ave
- 1001 Cedar Ave
- 791 Redwood Ave
- 342 C St
- 1000 1st St
- 1016 Iris St
- 911 Oleander Ct
Your Personal Tour Guide
Ask me questions while you tour the home.