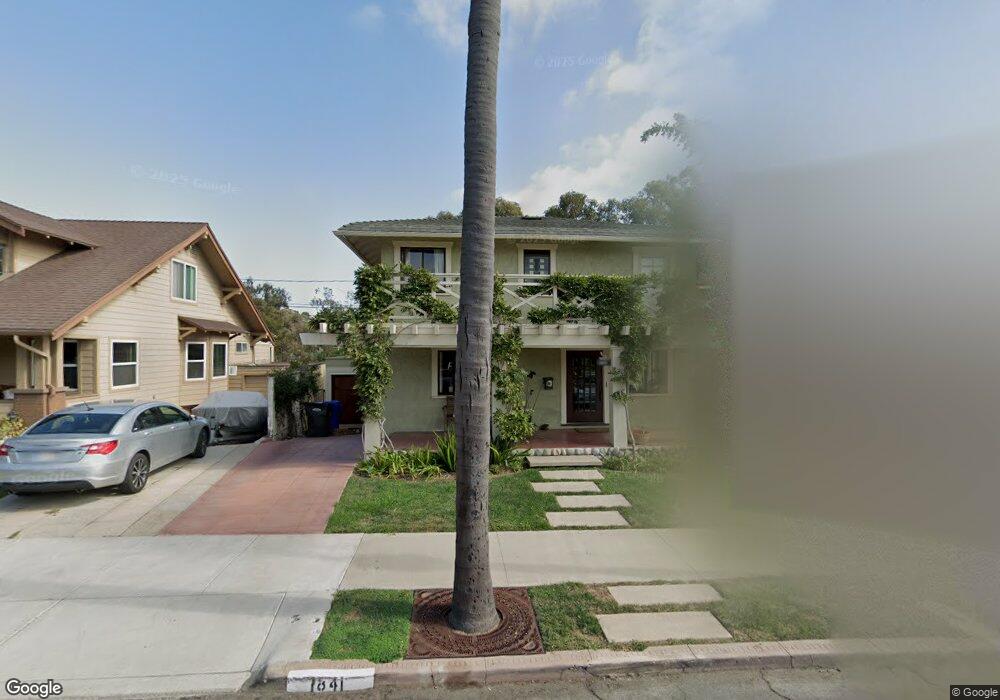
1841 Lyndon Rd San Diego, CA 92103
Mission Hills NeighborhoodEstimated Value: $2,418,000 - $2,564,000
3
Beds
3
Baths
2,526
Sq Ft
$988/Sq Ft
Est. Value
About This Home
This home is located at 1841 Lyndon Rd, San Diego, CA 92103 and is currently estimated at $2,496,205, approximately $988 per square foot. 1841 Lyndon Rd is a home located in San Diego County with nearby schools including Grant K-8, Richard Henry Dana Middle School, and Roosevelt International Middle School.
Ownership History
Date
Name
Owned For
Owner Type
Purchase Details
Closed on
Oct 19, 2013
Sold by
Arbogast Mark H and Arbogast Debra L
Bought by
Arbogast Mark H and Arbogast Debra Lynn
Current Estimated Value
Purchase Details
Closed on
Sep 16, 2006
Sold by
Arbogast Mark H
Bought by
Arbogast Mark H and Arbogast Debra L
Purchase Details
Closed on
May 26, 2006
Sold by
Arbocast Debra L
Bought by
Arbogast Mark H
Home Financials for this Owner
Home Financials are based on the most recent Mortgage that was taken out on this home.
Original Mortgage
$58,000
Outstanding Balance
$34,061
Interest Rate
6.55%
Mortgage Type
Credit Line Revolving
Estimated Equity
$2,462,144
Purchase Details
Closed on
May 10, 2006
Sold by
Hawes Jonathan W and Hawes Janet R
Bought by
Arbogast Mark H
Home Financials for this Owner
Home Financials are based on the most recent Mortgage that was taken out on this home.
Original Mortgage
$58,000
Outstanding Balance
$34,061
Interest Rate
6.55%
Mortgage Type
Credit Line Revolving
Estimated Equity
$2,462,144
Purchase Details
Closed on
Aug 19, 1988
Create a Home Valuation Report for This Property
The Home Valuation Report is an in-depth analysis detailing your home's value as well as a comparison with similar homes in the area
Home Values in the Area
Average Home Value in this Area
Purchase History
| Date | Buyer | Sale Price | Title Company |
|---|---|---|---|
| Arbogast Mark H | -- | None Available | |
| Arbogast Mark H | -- | None Available | |
| Arbogast Mark H | -- | California Title Company | |
| Arbogast Mark H | $1,160,000 | California Title Company | |
| -- | $331,600 | -- |
Source: Public Records
Mortgage History
| Date | Status | Borrower | Loan Amount |
|---|---|---|---|
| Open | Arbogast Mark H | $58,000 | |
| Open | Arbogast Mark H | $812,000 |
Source: Public Records
Tax History Compared to Growth
Tax History
| Year | Tax Paid | Tax Assessment Tax Assessment Total Assessment is a certain percentage of the fair market value that is determined by local assessors to be the total taxable value of land and additions on the property. | Land | Improvement |
|---|---|---|---|---|
| 2025 | $20,868 | $1,737,489 | $1,095,993 | $641,496 |
| 2024 | $20,868 | $1,703,421 | $1,074,503 | $628,918 |
| 2023 | $20,407 | $1,670,022 | $1,053,435 | $616,587 |
| 2022 | $19,863 | $1,637,278 | $1,032,780 | $604,498 |
| 2021 | $18,429 | $1,500,000 | $900,000 | $600,000 |
| 2020 | $18,394 | $1,500,000 | $900,000 | $600,000 |
| 2019 | $17,810 | $1,450,000 | $900,000 | $550,000 |
| 2018 | $15,807 | $1,350,000 | $864,000 | $486,000 |
| 2017 | $14,571 | $1,250,000 | $800,000 | $450,000 |
| 2016 | $12,689 | $1,085,000 | $687,000 | $398,000 |
| 2015 | $11,693 | $1,000,000 | $687,000 | $313,000 |
| 2014 | $10,736 | $915,000 | $629,000 | $286,000 |
Source: Public Records
Map
Nearby Homes
- 1864 Sunset Blvd
- 1753 W Lewis St
- 3770 Keating St
- 1728 W Lewis St
- 1860 W Montecito Way
- 4232 Arden Way
- 1695 Neale St
- 1694 Torrance St
- 3625 Keating St Unit 4
- 1329 Fort Stockton Dr
- 2120 Pine St
- 1806 Mckee St Unit A2
- 1806 Mckee St Unit A9
- 3903 California St Unit 3
- 2147 Pine St
- Lot 19 Randolph St
- 3972 Jackdaw St
- 3972 Jackdaw St Unit 109
- 3519 Andrews St
- 2045 W California St
- 1833 Lyndon Rd
- 1831 Lyndon Rd
- 1849 Lyndon Rd
- 1840 Lyndon Rd
- 1848 Lyndon Rd
- 1819 Lyndon Rd
- 1820 Lyndon Rd
- 1850 Lyndon Rd
- 1811 Lyndon Rd
- 1812 Lyndon Rd
- 1805 Lyndon Rd
- 1801 Lyndon Rd
- 1853 Lyndon Rd
- 1808 Lyndon Rd
- 1868 Lyndon Rd
- 1859 Sheridan Ave
- 1845 Sheridan Ave
- 1855 Lyndon Rd
- 1867 Sheridan Ave
- 1825 Sheridan Ave