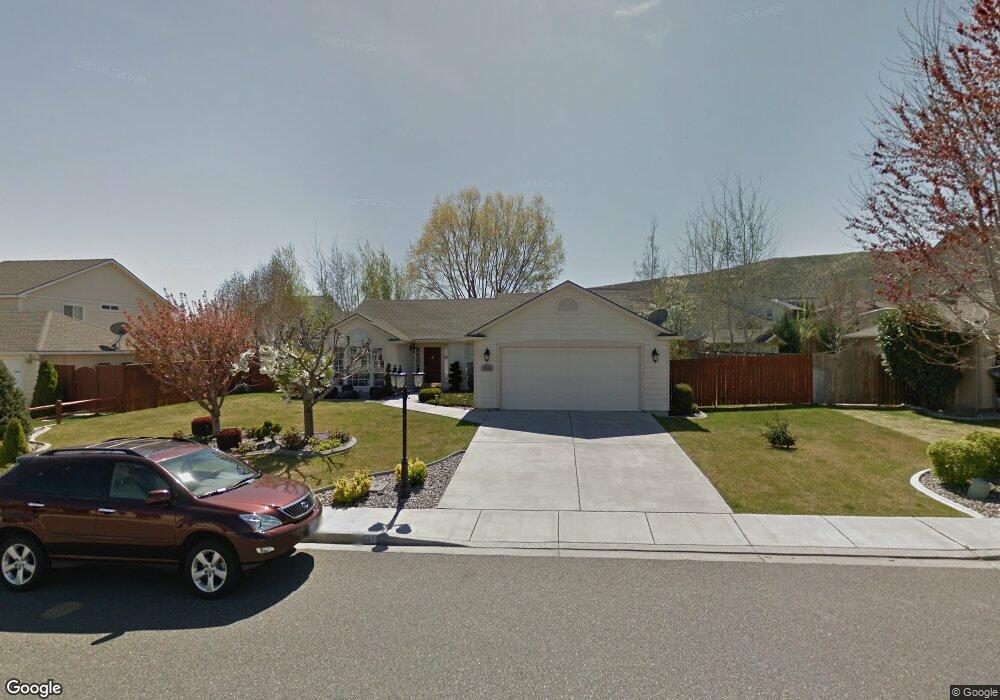
1841 Maui Dr Richland, WA 99352
Estimated Value: $423,613 - $457,000
4
Beds
2
Baths
1,688
Sq Ft
$259/Sq Ft
Est. Value
About This Home
This home is located at 1841 Maui Dr, Richland, WA 99352 and is currently estimated at $437,153, approximately $258 per square foot. 1841 Maui Dr is a home located in Benton County with nearby schools including Orchard Elementary School, Enterprise Middle School, and Richland High School.
Ownership History
Date
Name
Owned For
Owner Type
Purchase Details
Closed on
Jan 25, 2019
Sold by
Young Thomas Joe
Bought by
Chavoshi Sam and Same Leila
Current Estimated Value
Home Financials for this Owner
Home Financials are based on the most recent Mortgage that was taken out on this home.
Original Mortgage
$280,330
Outstanding Balance
$246,460
Interest Rate
4.5%
Mortgage Type
New Conventional
Estimated Equity
$190,693
Purchase Details
Closed on
Jul 2, 2018
Sold by
Ca Kooilker Investments Llc
Bought by
Young Thomas Joe
Purchase Details
Closed on
Sep 7, 2011
Sold by
Drassal Roy A and Drassal Diana
Bought by
Ca Kooiker Investments Llc
Purchase Details
Closed on
Jan 16, 2007
Sold by
Lee Jae H and Lee Miran
Bought by
Drassal Roy A
Home Financials for this Owner
Home Financials are based on the most recent Mortgage that was taken out on this home.
Original Mortgage
$182,929
Interest Rate
6.09%
Mortgage Type
VA
Create a Home Valuation Report for This Property
The Home Valuation Report is an in-depth analysis detailing your home's value as well as a comparison with similar homes in the area
Home Values in the Area
Average Home Value in this Area
Purchase History
| Date | Buyer | Sale Price | Title Company |
|---|---|---|---|
| Chavoshi Sam | $336,222 | Cascade Title Co | |
| Young Thomas Joe | $311,209 | Cascade Title Co | |
| Ca Kooiker Investments Llc | $200,000 | Cascade Title | |
| Drassal Roy A | $177,000 | Cascade Title |
Source: Public Records
Mortgage History
| Date | Status | Borrower | Loan Amount |
|---|---|---|---|
| Open | Chavoshi Sam | $280,330 | |
| Previous Owner | Drassal Roy A | $182,929 |
Source: Public Records
Tax History Compared to Growth
Tax History
| Year | Tax Paid | Tax Assessment Tax Assessment Total Assessment is a certain percentage of the fair market value that is determined by local assessors to be the total taxable value of land and additions on the property. | Land | Improvement |
|---|---|---|---|---|
| 2024 | $3,259 | $363,500 | $85,000 | $278,500 |
| 2023 | $3,259 | $347,580 | $85,000 | $262,580 |
| 2022 | $2,976 | $291,880 | $85,000 | $206,880 |
| 2021 | $2,918 | $268,010 | $85,000 | $183,010 |
| 2020 | $2,823 | $252,100 | $85,000 | $167,100 |
| 2019 | $2,392 | $230,570 | $44,000 | $186,570 |
| 2018 | $2,482 | $209,840 | $44,000 | $165,840 |
| 2017 | $2,185 | $182,200 | $44,000 | $138,200 |
| 2016 | $285 | $182,200 | $44,000 | $138,200 |
| 2015 | $2,473 | $182,200 | $44,000 | $138,200 |
| 2014 | -- | $182,200 | $44,000 | $138,200 |
| 2013 | -- | $182,200 | $44,000 | $138,200 |
Source: Public Records
Map
Nearby Homes
- 1942 Sky Meadow Ave
- 2172 Newhaven Loop
- 1640 Palermo Ave
- 1924 Mint Loop
- 309 Falconridge St
- 3 Keene Rd Unit Lot 3
- 2 Keene Rd Unit Lot 2
- 1 Keene Rd Unit Lot 1
- 483 Aimee Dr
- 316 Soaring Hawk St
- 1606 Elementary St
- 2042 Morency Dr
- 183 Mcintosh Ct
- 1557 Livorno Ave
- 204 Brookwood Loop
- 1641 Brantingham Rd
- 2258 Morency Dr
- 481 Clermont Dr
- 430 Keene Rd
- 1325 Brookwood Ave