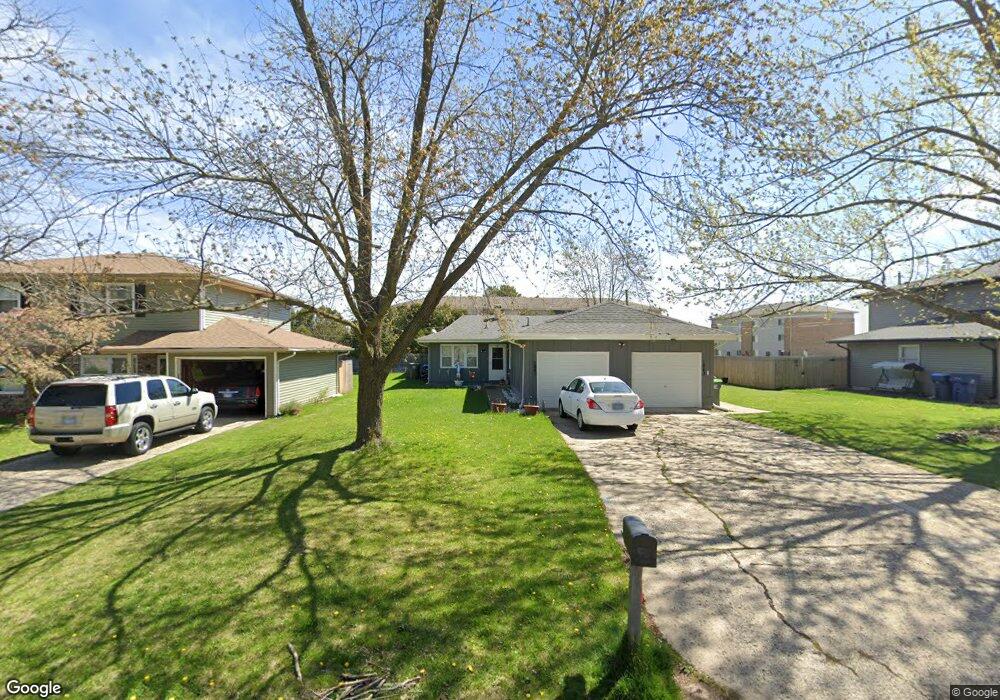
1841 Mulberry Dr Unit 4 Montgomery, IL 60538
Estimated Value: $226,000 - $262,000
2
Beds
1
Bath
852
Sq Ft
$287/Sq Ft
Est. Value
About This Home
This home is located at 1841 Mulberry Dr Unit 4, Montgomery, IL 60538 and is currently estimated at $244,756, approximately $287 per square foot. 1841 Mulberry Dr Unit 4 is a home located in Kane County with nearby schools including Nicholson Elementary School, Washington Middle School, and West Aurora High School.
Ownership History
Date
Name
Owned For
Owner Type
Purchase Details
Closed on
Aug 18, 2017
Sold by
Fahrlander Stephanie and Fahrlander Patricia
Bought by
Figuera Carmen I and Figuera Carmen M
Current Estimated Value
Home Financials for this Owner
Home Financials are based on the most recent Mortgage that was taken out on this home.
Original Mortgage
$77,838
Outstanding Balance
$65,072
Interest Rate
4.03%
Mortgage Type
FHA
Estimated Equity
$179,684
Purchase Details
Closed on
Mar 8, 2012
Sold by
Kendall Partners Ltd
Bought by
Fahrlander Stephanie and Fahrlander Patricia
Home Financials for this Owner
Home Financials are based on the most recent Mortgage that was taken out on this home.
Original Mortgage
$66,276
Interest Rate
3.95%
Mortgage Type
FHA
Purchase Details
Closed on
Nov 3, 2011
Sold by
Deutsche Bank National Trust Company
Bought by
Kendall Partners Ltd
Purchase Details
Closed on
Jun 27, 2011
Sold by
Stevens Sharon
Bought by
Deutsche Bank National Trust Company
Purchase Details
Closed on
Apr 15, 1993
Sold by
Isel Ernie L and Isel Susan A
Bought by
Stevens Sharon
Create a Home Valuation Report for This Property
The Home Valuation Report is an in-depth analysis detailing your home's value as well as a comparison with similar homes in the area
Home Values in the Area
Average Home Value in this Area
Purchase History
| Date | Buyer | Sale Price | Title Company |
|---|---|---|---|
| Figuera Carmen I | $90,000 | Fidelity National Title | |
| Fahrlander Stephanie | $68,000 | Chicago Title Insurance Co | |
| Kendall Partners Ltd | $25,000 | None Available | |
| Deutsche Bank National Trust Company | -- | None Available | |
| Stevens Sharon | $25,000 | Lawyers Title Insurance Corp |
Source: Public Records
Mortgage History
| Date | Status | Borrower | Loan Amount |
|---|---|---|---|
| Open | Figuera Carmen I | $77,838 | |
| Previous Owner | Fahrlander Stephanie | $66,276 |
Source: Public Records
Tax History Compared to Growth
Tax History
| Year | Tax Paid | Tax Assessment Tax Assessment Total Assessment is a certain percentage of the fair market value that is determined by local assessors to be the total taxable value of land and additions on the property. | Land | Improvement |
|---|---|---|---|---|
| 2024 | $2,006 | $58,765 | $6,629 | $52,136 |
| 2023 | $2,170 | $48,548 | $5,923 | $42,625 |
| 2022 | $2,648 | $47,145 | $5,404 | $41,741 |
| 2021 | $3,143 | $43,892 | $5,031 | $38,861 |
| 2020 | $2,951 | $40,769 | $4,673 | $36,096 |
| 2019 | $2,807 | $37,377 | $4,330 | $33,047 |
| 2018 | $2,621 | $34,491 | $4,005 | $30,486 |
| 2017 | $2,526 | $32,604 | $3,690 | $28,914 |
| 2016 | $2,275 | $29,103 | $3,163 | $25,940 |
| 2015 | -- | $26,092 | $2,720 | $23,372 |
| 2014 | -- | $24,230 | $2,616 | $21,614 |
| 2013 | -- | $23,886 | $2,579 | $21,307 |
Source: Public Records
Map
Nearby Homes
- 2242 Brentwood Ave
- 2326 Brentwood Ave
- 1745 Lyndale Rd
- 2092 William Dr
- 2371 Mayfield Dr
- 1 Highway 30
- 2021 Radcliffe Dr
- 1031 Lindenwood Dr
- 977 Lindenwood Dr
- 158 Concord Dr S
- 2417 Geneva Ln Unit 3
- 125 S Main St
- 2091 Jericho Rd
- 888 Summerhill Dr Unit 2
- 2257 Rebecca Cir
- 5.43 B-3 Commercial State Route 31
- 11-13 W Anchor Rd
- 2904 Shetland Ln
- 17 Knollwood Dr Unit 3
- 7.43 Acres Vacant La State Route 31
- 1843 Mulberry Dr
- 1837 Mulberry Dr Unit 39
- 1845 Mulberry Dr Unit 47
- 1833 Mulberry Dr Unit 35
- 1748 Brentwood Ave
- 1829 Mulberry Dr Unit 31
- 1818 Mulberry Dr
- 1820 Mulberry Dr Unit 4
- 1816 Mulberry Dr Unit 4
- 2239 Brentwood Ave Unit 4
- 2228 Brentwood Ave Unit 28
- 1825 Mulberry Dr Unit 27
- 2234 Brentwood Ave Unit 2234
- 1814 Mulberry Dr
- 2226 Brentwood Ave Unit 28
- 1924 Kevin Dr
- 2230 Brentwood Ave Unit 36
- 1928 Kevin Dr
- 1812 Mulberry Dr
- 1821 Mulberry Dr Unit 23