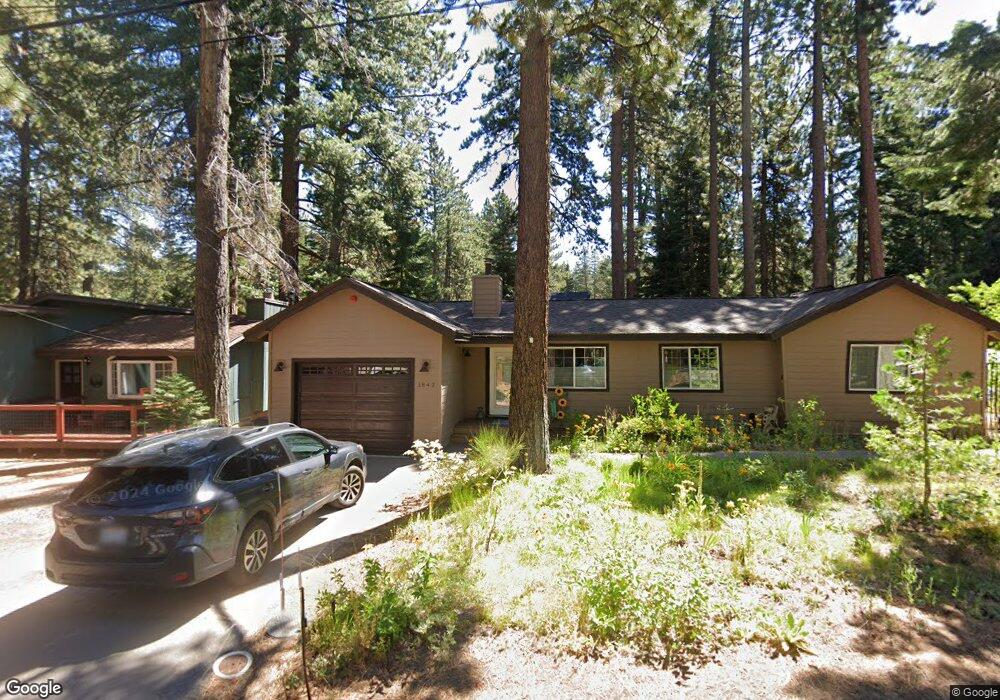
1842 13th St South Lake Tahoe, CA 96150
Estimated Value: $564,000 - $850,000
3
Beds
2
Baths
1,530
Sq Ft
$443/Sq Ft
Est. Value
About This Home
This home is located at 1842 13th St, South Lake Tahoe, CA 96150 and is currently estimated at $678,381, approximately $443 per square foot. 1842 13th St is a home located in El Dorado County with nearby schools including Tahoe Valley Elementary School, South Tahoe Middle School, and South Tahoe High School.
Ownership History
Date
Name
Owned For
Owner Type
Purchase Details
Closed on
Mar 19, 2002
Sold by
Allen Richard H and Allen Tara K
Bought by
Bell Marvin and Bell Kristina
Current Estimated Value
Purchase Details
Closed on
Jul 24, 2001
Sold by
Laforce Brian F
Bought by
Allen Richard H and Allen Tara K
Home Financials for this Owner
Home Financials are based on the most recent Mortgage that was taken out on this home.
Original Mortgage
$91,500
Interest Rate
7.1%
Purchase Details
Closed on
Sep 28, 1999
Sold by
Laforce Brian F and Laforce Brian Foster
Bought by
Laforce Brian F
Purchase Details
Closed on
Feb 3, 1999
Sold by
Jarvis James L and Mcclue Charles R
Bought by
Laforce Brian Foster
Purchase Details
Closed on
Feb 14, 1996
Sold by
Holbrook Mary Ann and Sczepanski Joseph Paul
Bought by
Laforce Brian F
Home Financials for this Owner
Home Financials are based on the most recent Mortgage that was taken out on this home.
Original Mortgage
$55,200
Interest Rate
7.1%
Create a Home Valuation Report for This Property
The Home Valuation Report is an in-depth analysis detailing your home's value as well as a comparison with similar homes in the area
Home Values in the Area
Average Home Value in this Area
Purchase History
| Date | Buyer | Sale Price | Title Company |
|---|---|---|---|
| Bell Marvin | $194,000 | Fidelity National Title Co | |
| Allen Richard H | $161,500 | Fidelity National Title Co | |
| Laforce Brian F | -- | Fidelity National Title Co | |
| Laforce Brian Foster | $9,000 | First American Title Ins Co | |
| Lopes John J | -- | First American Title Ins Co | |
| Laforce Brian F | $69,500 | Old Republic Title Company |
Source: Public Records
Mortgage History
| Date | Status | Borrower | Loan Amount |
|---|---|---|---|
| Previous Owner | Allen Richard H | $91,500 | |
| Previous Owner | Laforce Brian F | $55,200 |
Source: Public Records
Tax History Compared to Growth
Tax History
| Year | Tax Paid | Tax Assessment Tax Assessment Total Assessment is a certain percentage of the fair market value that is determined by local assessors to be the total taxable value of land and additions on the property. | Land | Improvement |
|---|---|---|---|---|
| 2025 | $5,025 | $474,791 | $88,622 | $386,169 |
| 2024 | $5,025 | $465,483 | $86,885 | $378,598 |
| 2023 | $4,937 | $456,357 | $85,182 | $371,175 |
| 2022 | $4,889 | $447,410 | $83,512 | $363,898 |
| 2021 | $4,813 | $438,638 | $81,875 | $356,763 |
| 2020 | $4,744 | $434,141 | $81,036 | $353,105 |
| 2019 | $4,721 | $425,630 | $79,448 | $346,182 |
| 2018 | $4,616 | $417,286 | $77,891 | $339,395 |
| 2017 | $4,543 | $409,105 | $76,364 | $332,741 |
| 2016 | $3,392 | $303,584 | $74,867 | $228,717 |
| 2015 | $1,885 | $203,500 | $70,000 | $133,500 |
| 2014 | $1,885 | $168,000 | $52,000 | $116,000 |
Source: Public Records
Map
Nearby Homes
- 760 Clement St
- 753 Taylor Way
- 603 Gardner St
- 1761 13th St
- 1890 10th St
- 867 Clement St
- 516 Emerald Bay Rd Unit 49
- 516 Emerald Bay Rd Unit 426
- 629 James Ave
- 2028 13th St
- 673 James Ave
- 921 Gardner St
- 776 Patricia Ln
- 1124 Tata Ln
- 1080 Julie Ln Unit 255
- 1080 Julie Ln Unit 186
- 1080 Julie Ln Unit 79
- 1080 Julie Ln Unit 82
- 1080 Julie Ln Unit 140
- 1080 Julie Ln Unit 68