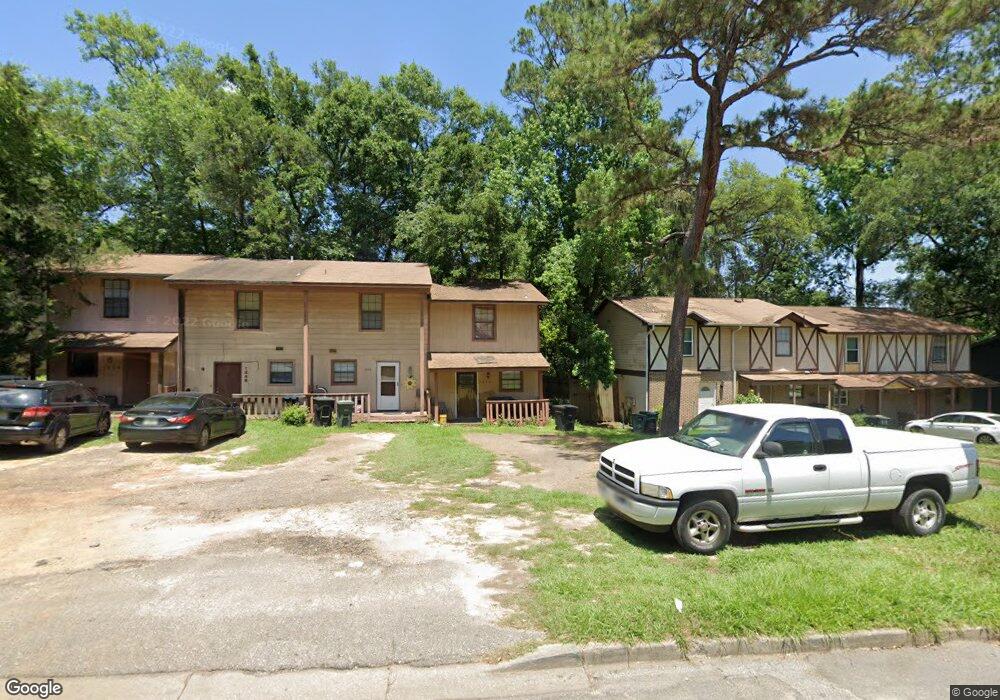
1842 Sylvan Ct Unit D Tallahassee, FL 32303
Hartsfield NeighborhoodEstimated Value: $130,568 - $164,000
2
Beds
2
Baths
896
Sq Ft
$160/Sq Ft
Est. Value
About This Home
This home is located at 1842 Sylvan Ct Unit D, Tallahassee, FL 32303 and is currently estimated at $143,142, approximately $159 per square foot. 1842 Sylvan Ct Unit D is a home located in Leon County with nearby schools including Astoria Park Elementary School, Griffin Middle School, and Amos P. Godby High School.
Ownership History
Date
Name
Owned For
Owner Type
Purchase Details
Closed on
Feb 15, 2018
Sold by
Lilly Luann
Bought by
Ten Square Rentals Llc
Current Estimated Value
Purchase Details
Closed on
Feb 2, 2018
Sold by
Lilly Luann and Wells Fargo Bank Na
Bought by
Tensquare Rentals Llc
Purchase Details
Closed on
Sep 13, 2006
Sold by
Lilly Paul J and Lilly Luann
Bought by
Lilly Luann
Purchase Details
Closed on
Feb 24, 1999
Sold by
Washburn Ann Elizabeth Mulli
Bought by
Lilly Luann
Home Financials for this Owner
Home Financials are based on the most recent Mortgage that was taken out on this home.
Original Mortgage
$45,335
Interest Rate
6.84%
Mortgage Type
FHA
Create a Home Valuation Report for This Property
The Home Valuation Report is an in-depth analysis detailing your home's value as well as a comparison with similar homes in the area
Home Values in the Area
Average Home Value in this Area
Purchase History
| Date | Buyer | Sale Price | Title Company |
|---|---|---|---|
| Ten Square Rentals Llc | $38,100 | -- | |
| Ten Square Rentals Llc | $38,100 | -- | |
| Tensquare Rentals Llc | $38,100 | None Available | |
| Lilly Luann | -- | None Available | |
| Lilly Luann | $44,900 | -- |
Source: Public Records
Mortgage History
| Date | Status | Borrower | Loan Amount |
|---|---|---|---|
| Previous Owner | Lilly Luann | $45,335 |
Source: Public Records
Tax History Compared to Growth
Tax History
| Year | Tax Paid | Tax Assessment Tax Assessment Total Assessment is a certain percentage of the fair market value that is determined by local assessors to be the total taxable value of land and additions on the property. | Land | Improvement |
|---|---|---|---|---|
| 2025 | $1,942 | $112,996 | $15,000 | $97,996 |
| 2024 | $1,751 | $99,545 | $15,000 | $84,545 |
| 2023 | $1,567 | $79,748 | $0 | $0 |
| 2022 | $1,392 | $78,033 | $10,000 | $68,033 |
| 2021 | $1,265 | $65,907 | $10,000 | $55,907 |
| 2020 | $1,175 | $62,143 | $10,000 | $52,143 |
| 2019 | $1,092 | $57,150 | $10,000 | $47,150 |
| 2018 | $1,052 | $54,539 | $10,000 | $44,539 |
| 2017 | $1,031 | $52,789 | $0 | $0 |
| 2016 | $505 | $51,476 | $0 | $0 |
| 2015 | $508 | $51,713 | $0 | $0 |
| 2014 | $508 | $51,303 | $0 | $0 |
Source: Public Records
Map
Nearby Homes
- 1846 Sylvan Ct
- 1802 Hartsfield Rd Unit A,B,C,D
- 1742 Hartsfield Rd Unit A-D
- 1819 Salmon Dr
- 2614 Mayfair Rd Unit 1
- 2533 Willamette Rd
- 2526 Old Bainbridge Rd
- 1821 Myrick Rd
- 1571 Stone Rd Unit 2-A
- 1917 Nanticoke Cir
- 2400 Fred Smith Rd Unit 201
- 2459 Nugget Ln
- 2467 Nugget Ln
- 2525 Nugget Ln Unit C
- 1986 Portland Ave
- 2521 Fred Smith Rd
- 2319 Hartsfield Way
- 2442 Talco Hills Dr Unit 2442, 2444, 2446
- 1325 Stone Rd Unit 202
- 1325 Stone Rd Unit 602
- 1842 Sylvan Ct
- 1844 Sylvan Ct Unit C
- 1844 Sylvan Ct
- 1840 Sylvan Ct Unit A
- 1840 Sylvan Ct
- 1846 Sylvan Ct Unit B
- 1838 Sylvan Ct
- 1848 Sylvan Ct
- 1836 Sylvan Ct Unit C
- 1836 Sylvan Ct
- 1850 Sylvan Ct
- 1834 Sylvan Ct
- 1852 Sylvan Ct
- 1854 Sylvan Ct
- 1805 Mayfair Rd
- 1856 Sylvan Ct
- 1803 Mayfair Rd
- 1807 Mayfair Rd Unit 3
- 1807 Mayfair Rd
- 1830 Sylvan Ct Unit C